Visuals
The full VA series: every visual with its alt text and caption; SVG source plus PNG/WebP derivatives in one click.
32 NARRATIVE VISUALS
Product and decision storytelling
Use in EN documents and EN pages; never place an EN visual on a TR surface.
Filters are an enhancement; with JS off every card stays visible.
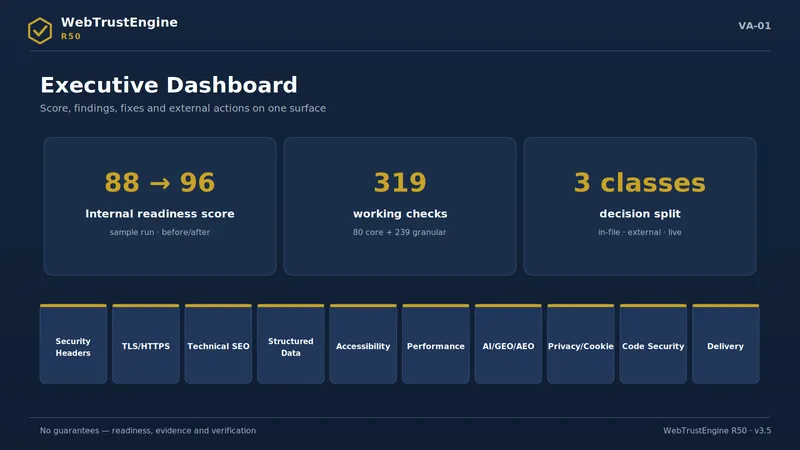
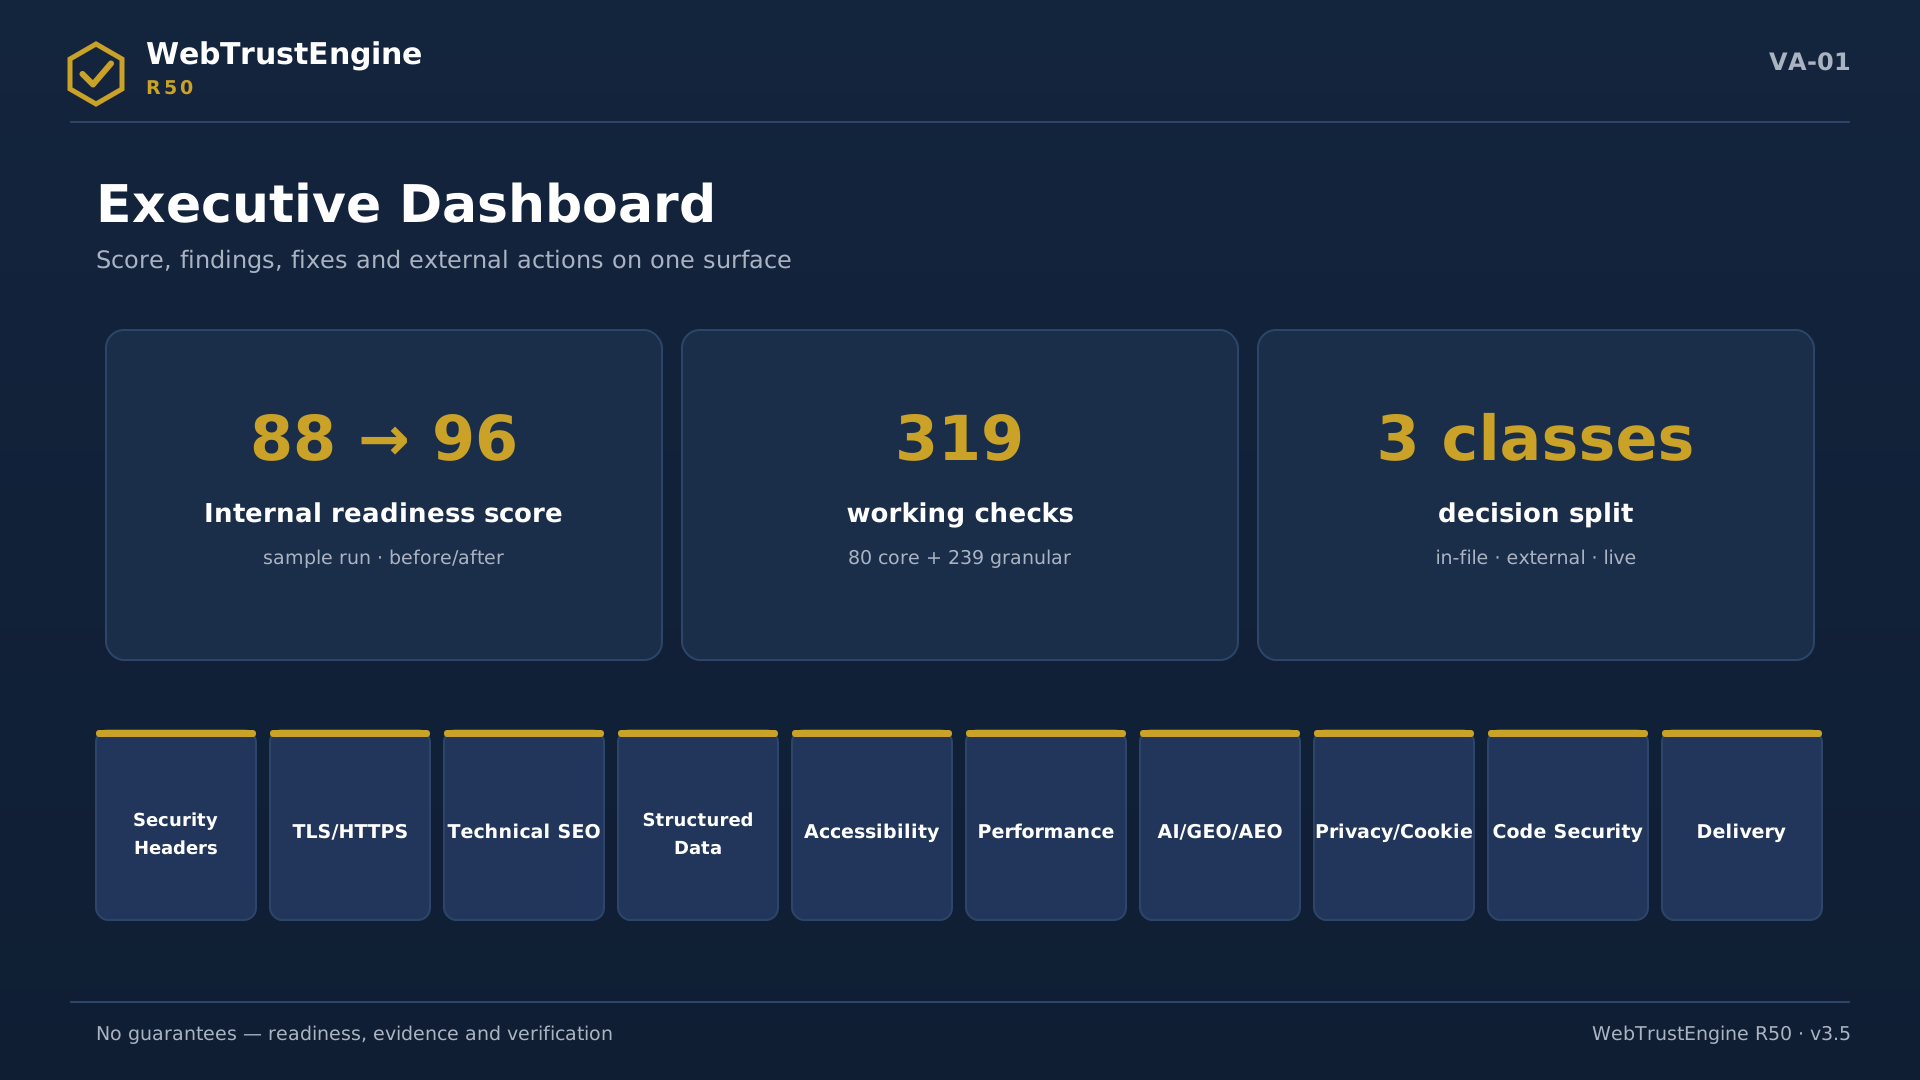
Executive dashboard: internal readiness score, classified findings and the decision split on one surface.

Executive dashboard: internal readiness score, classified findings and the decision split on one surface.

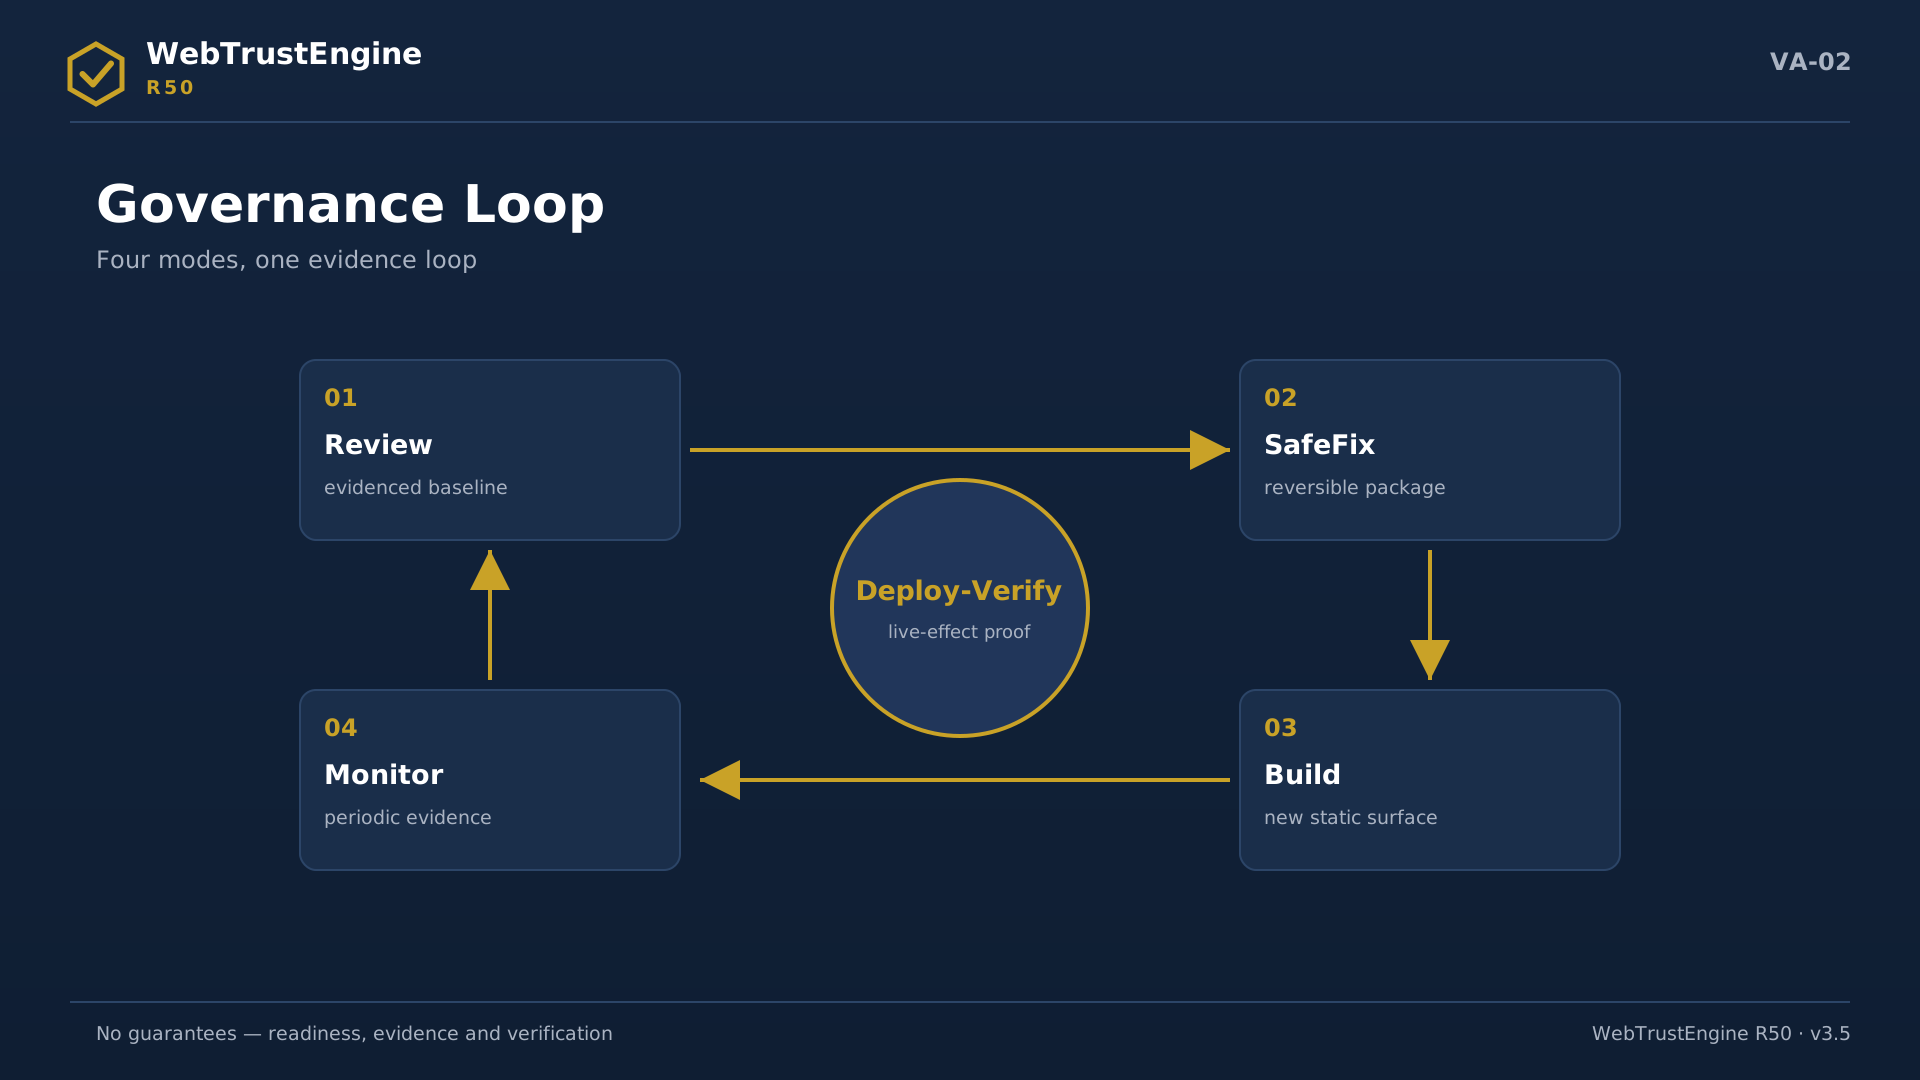
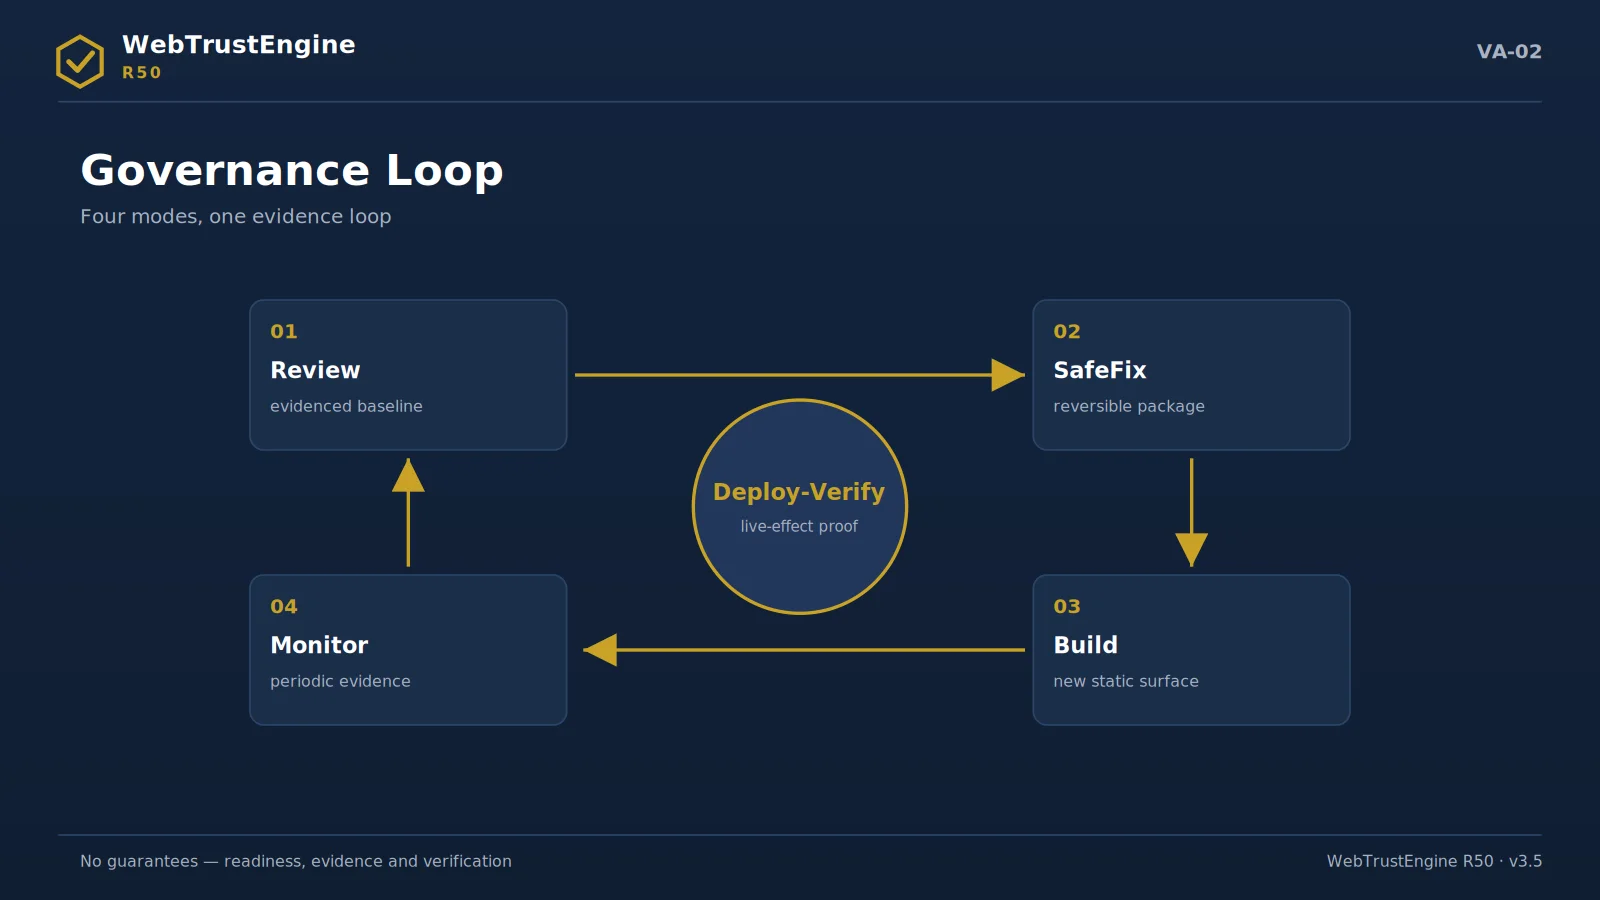
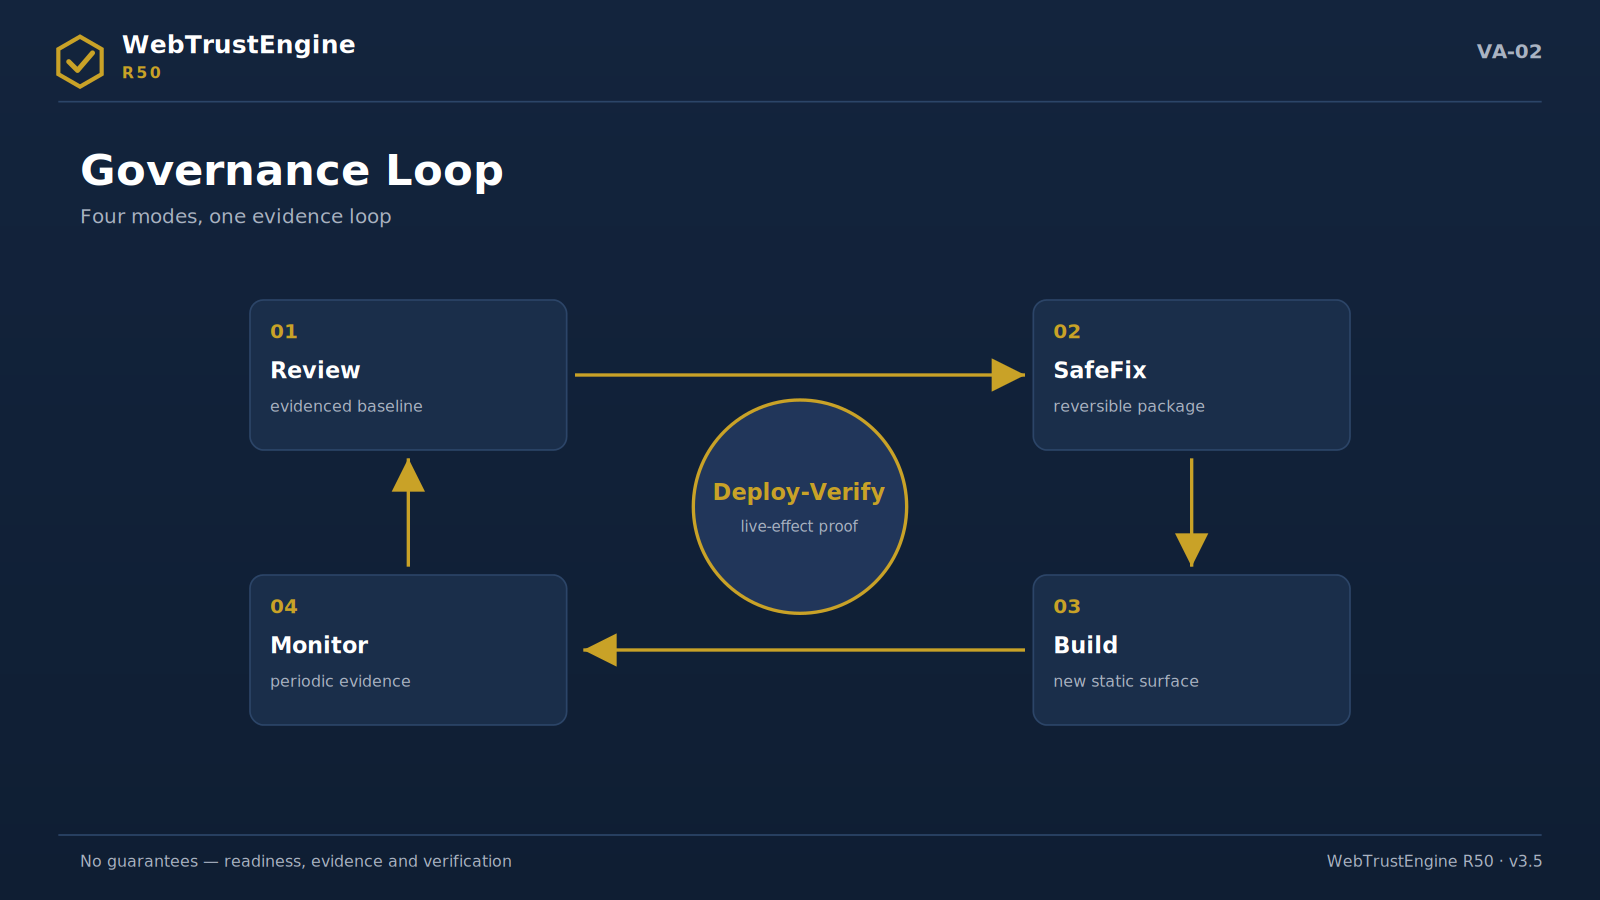
The governance loop: Review, SafeFix, Build and Monitor around a Deploy-Verify core.
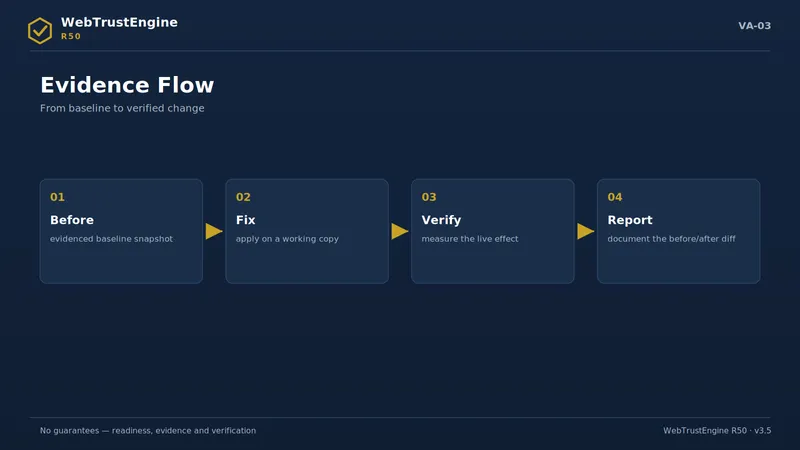
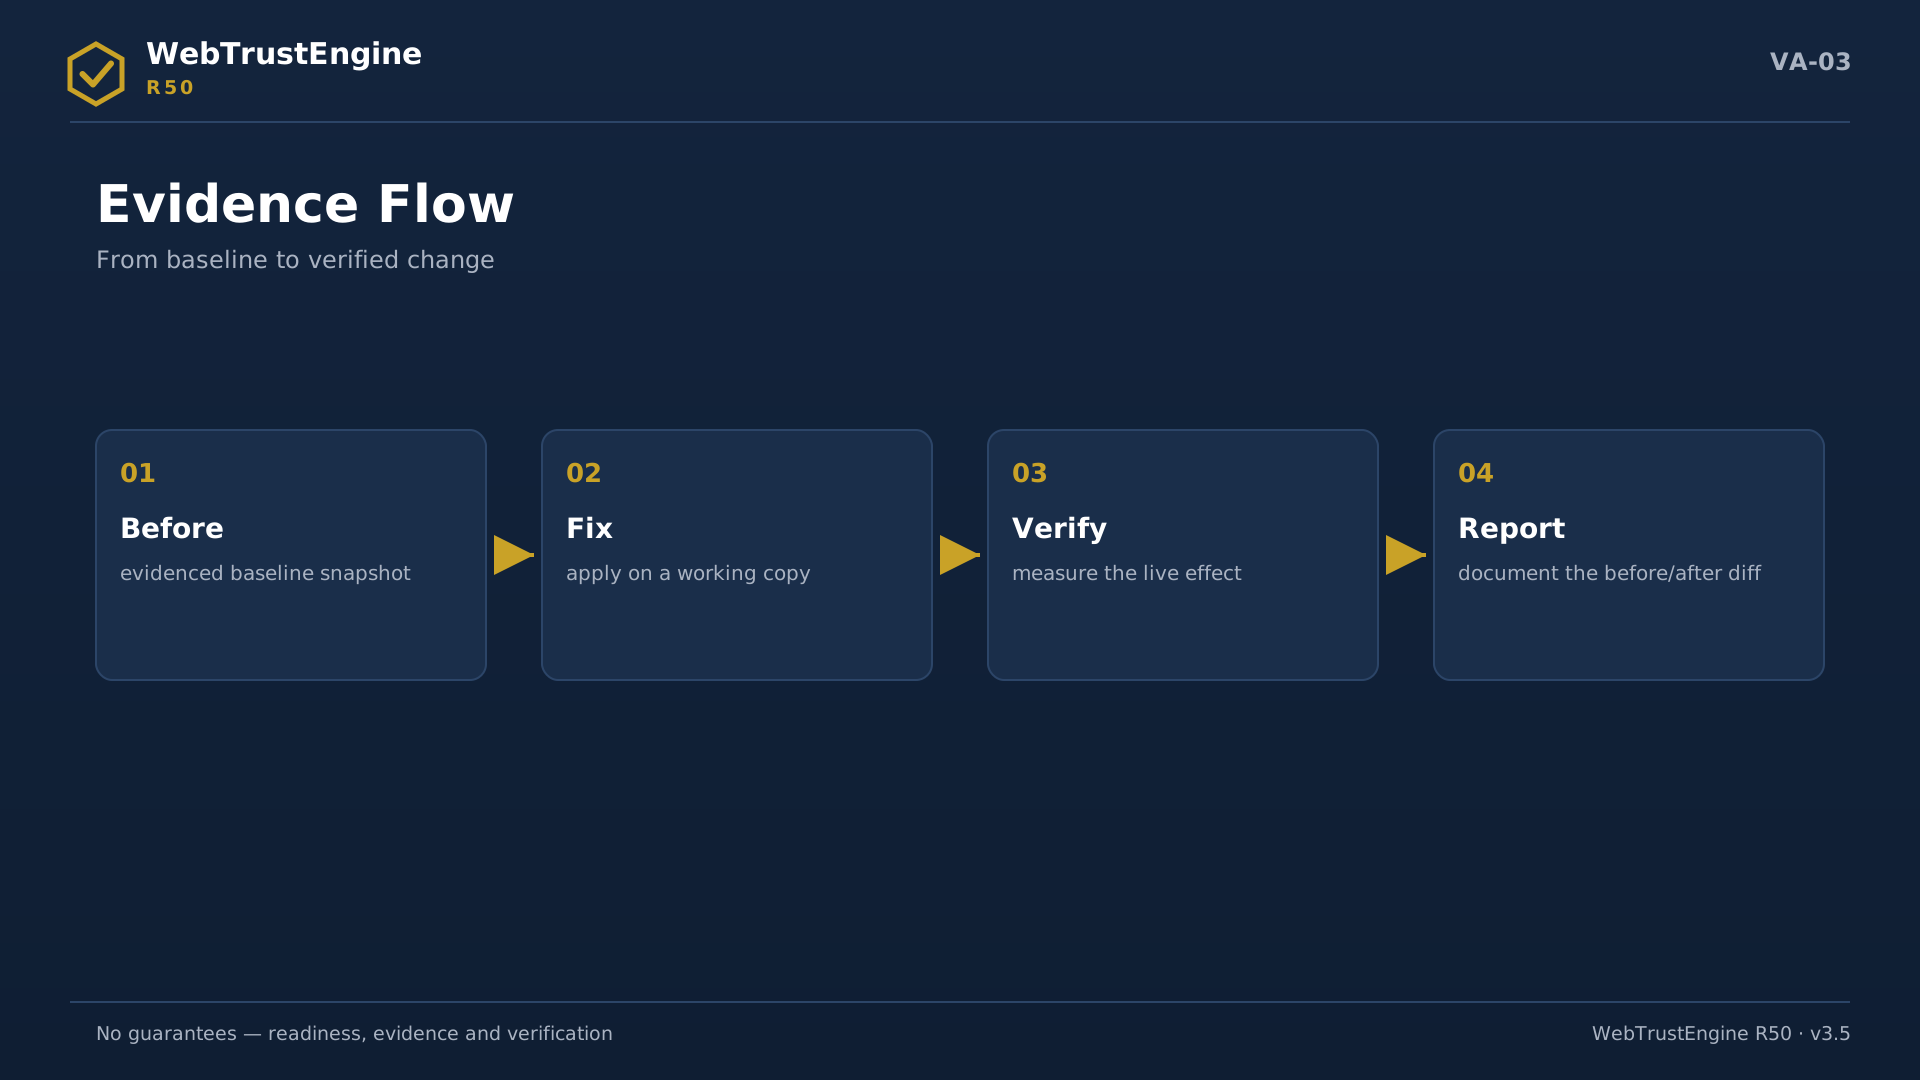
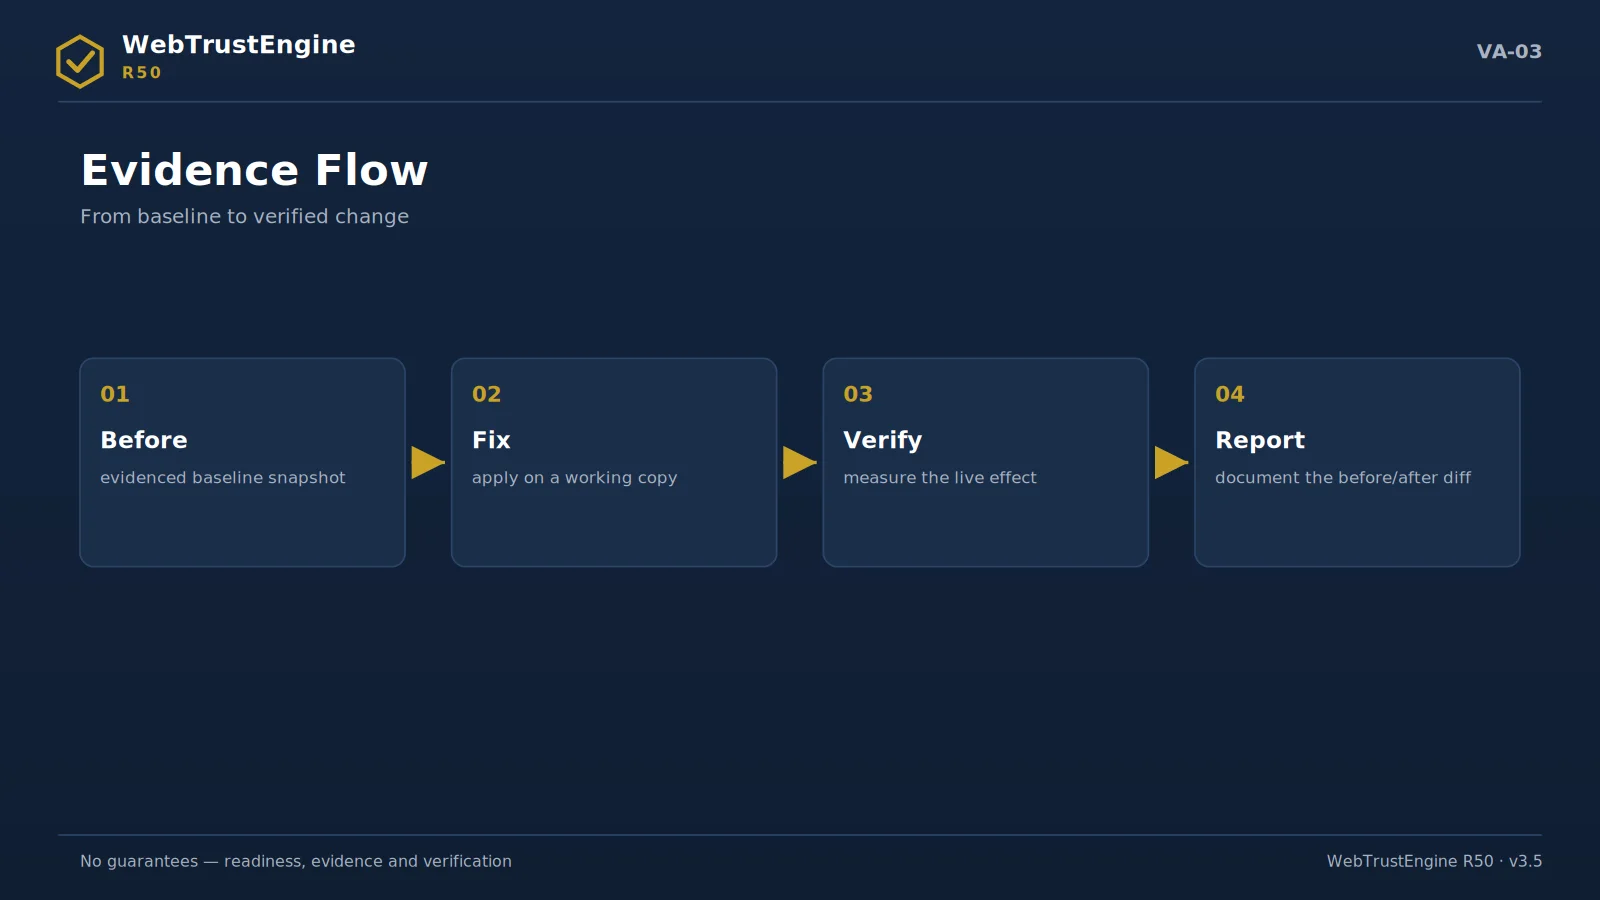
The evidence flow: before, fix, verify, report.

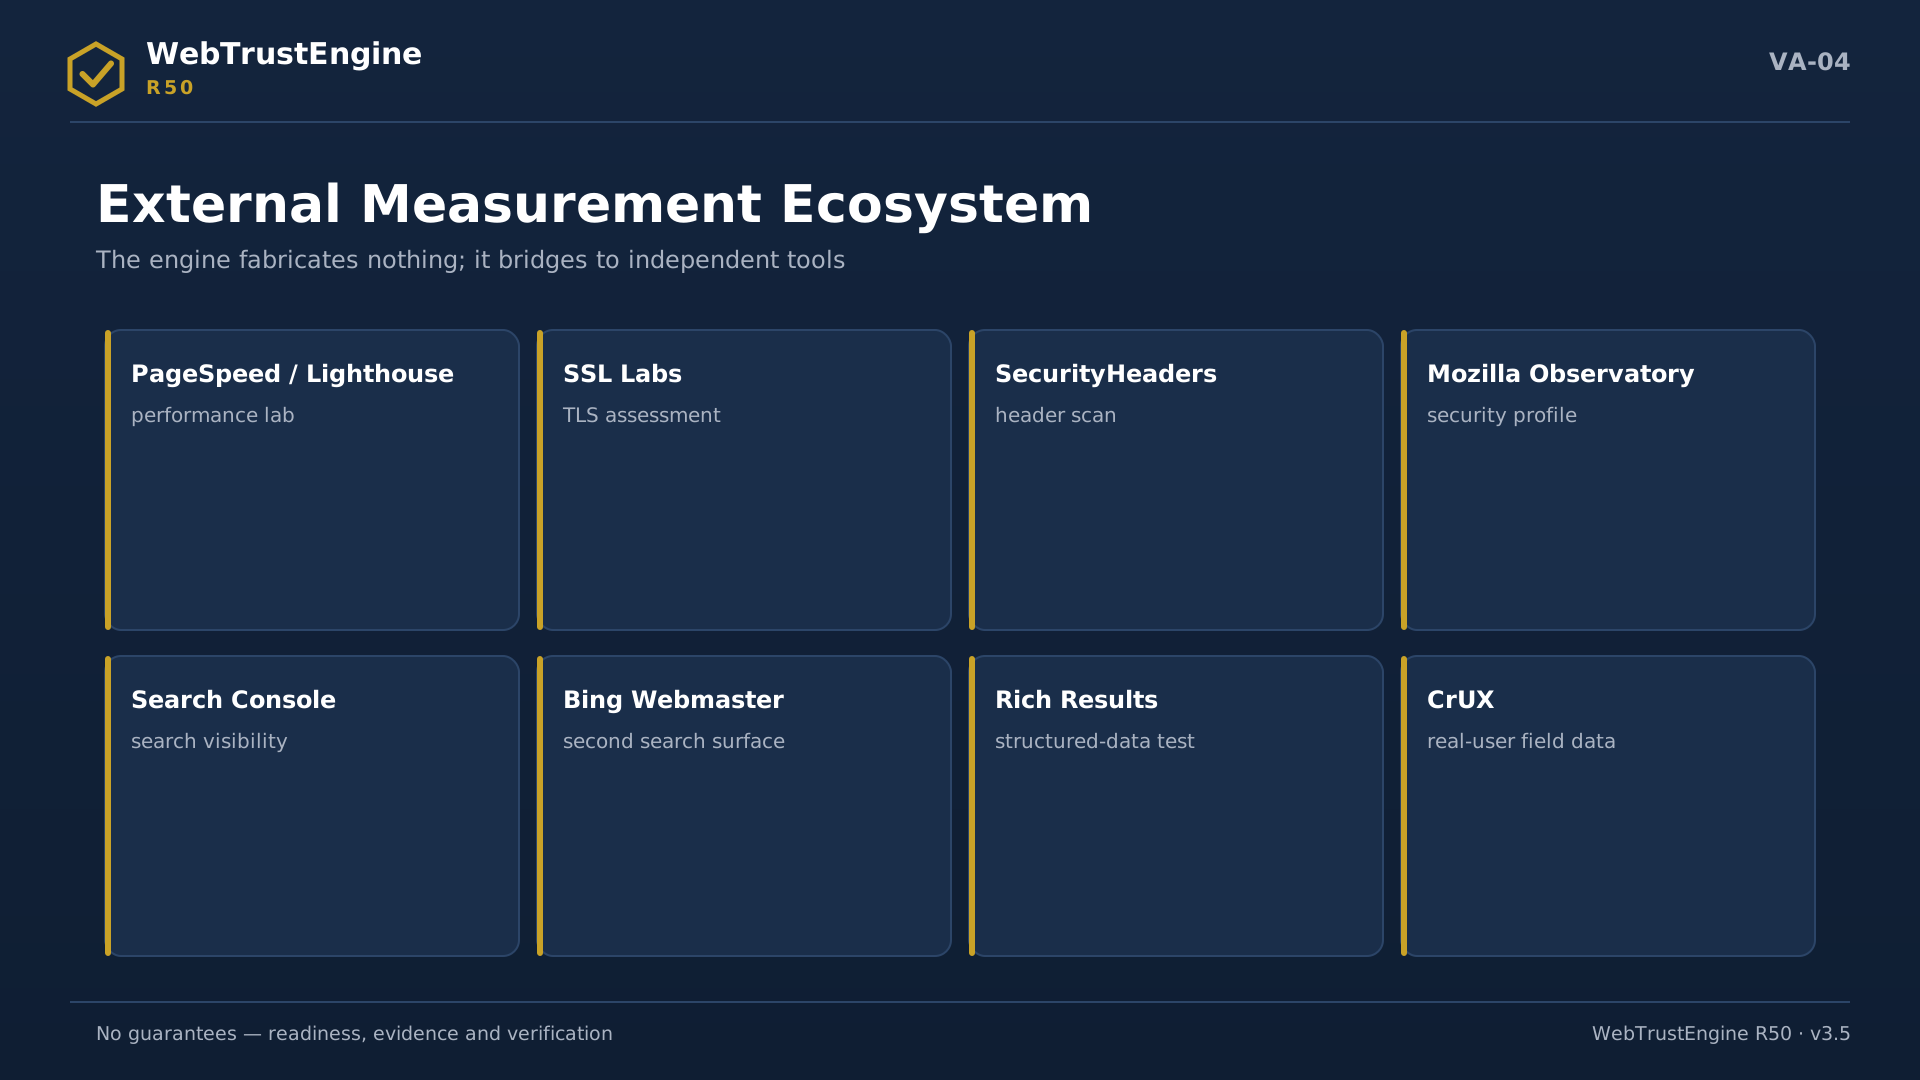
External measurement ecosystem: independent tools produce live scores; the engine binds results via bridges.

External measurement ecosystem: independent tools produce live scores; the engine binds results via bridges.
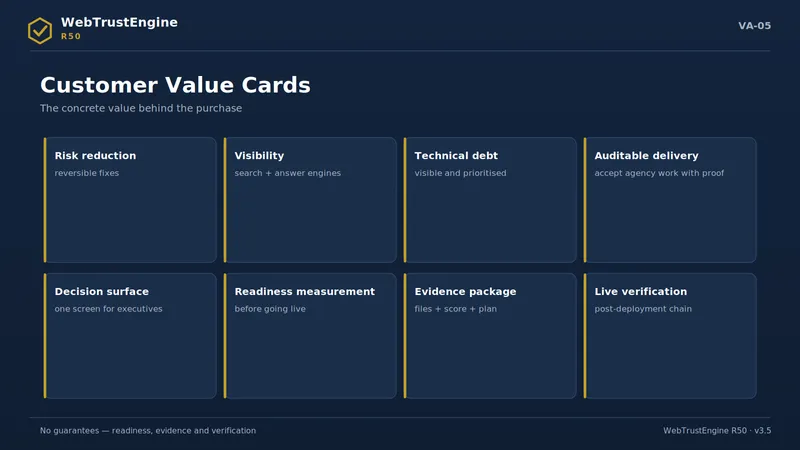
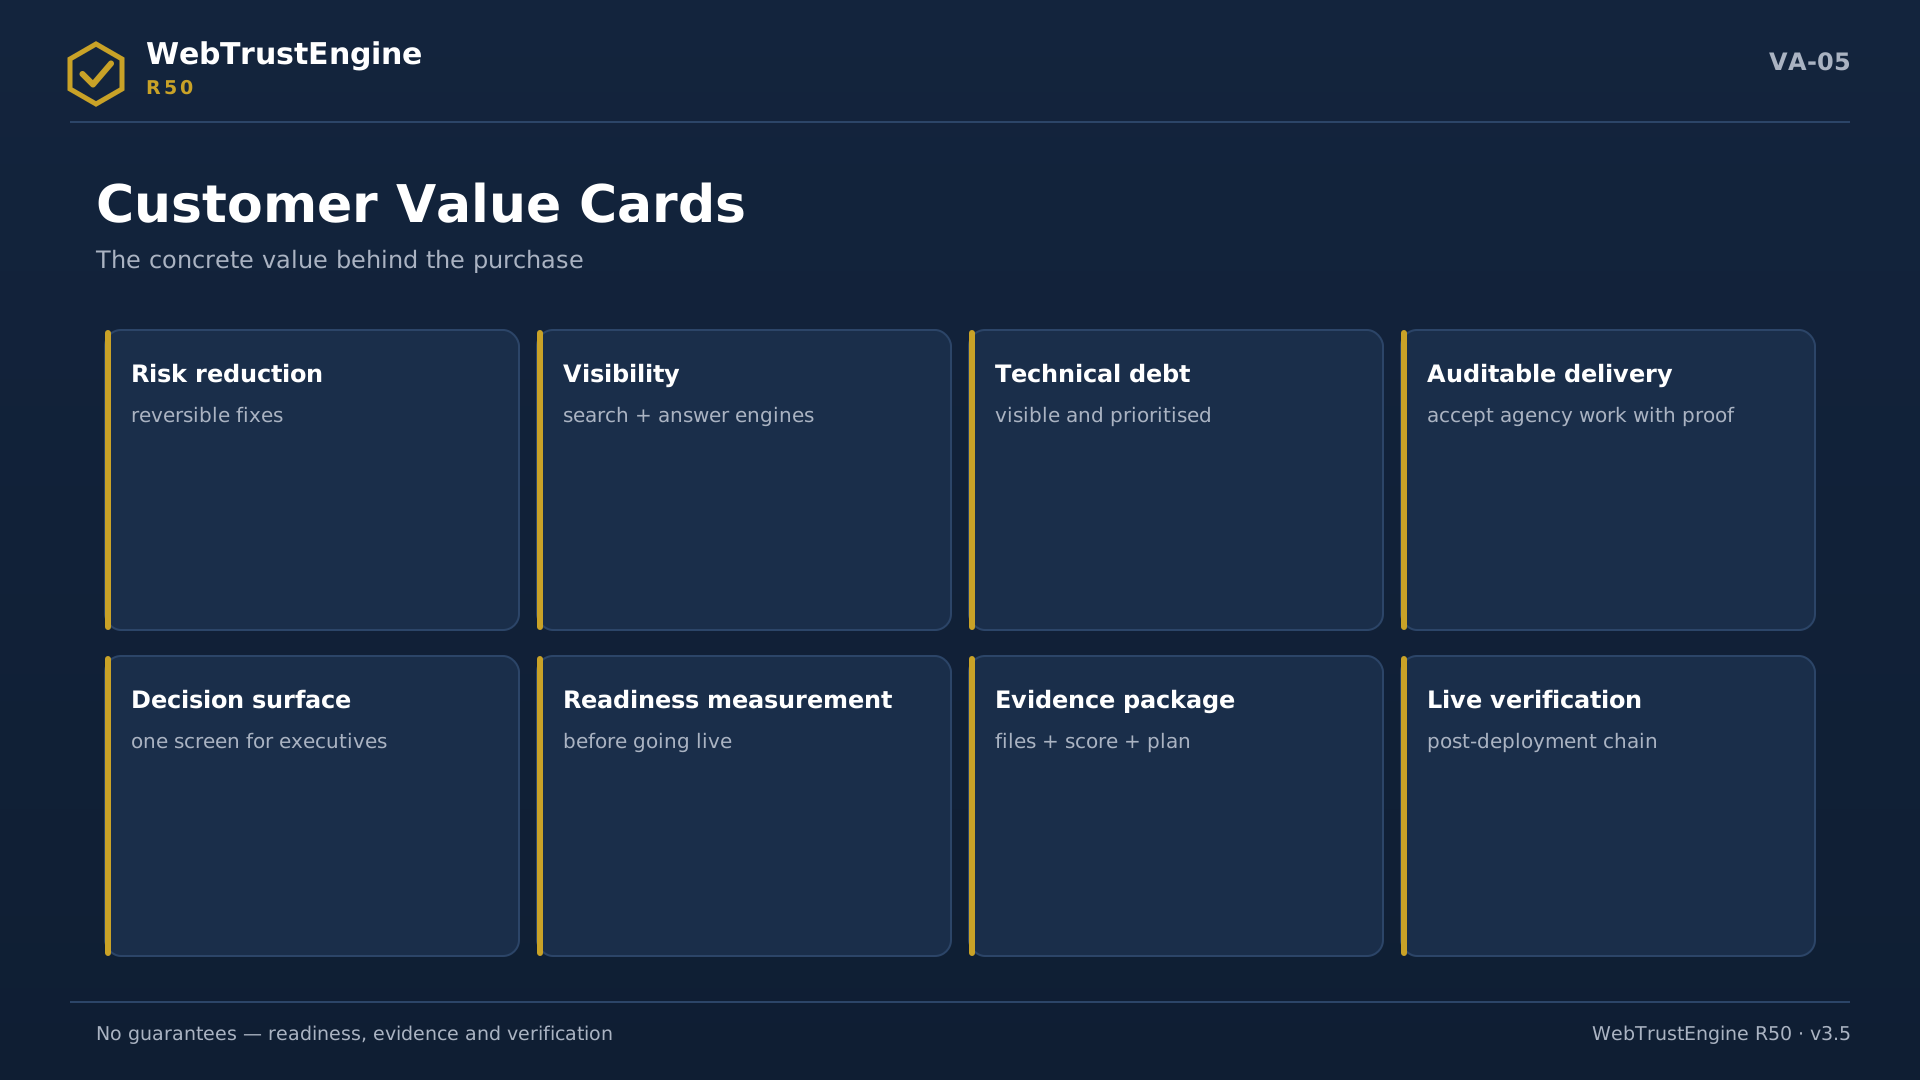
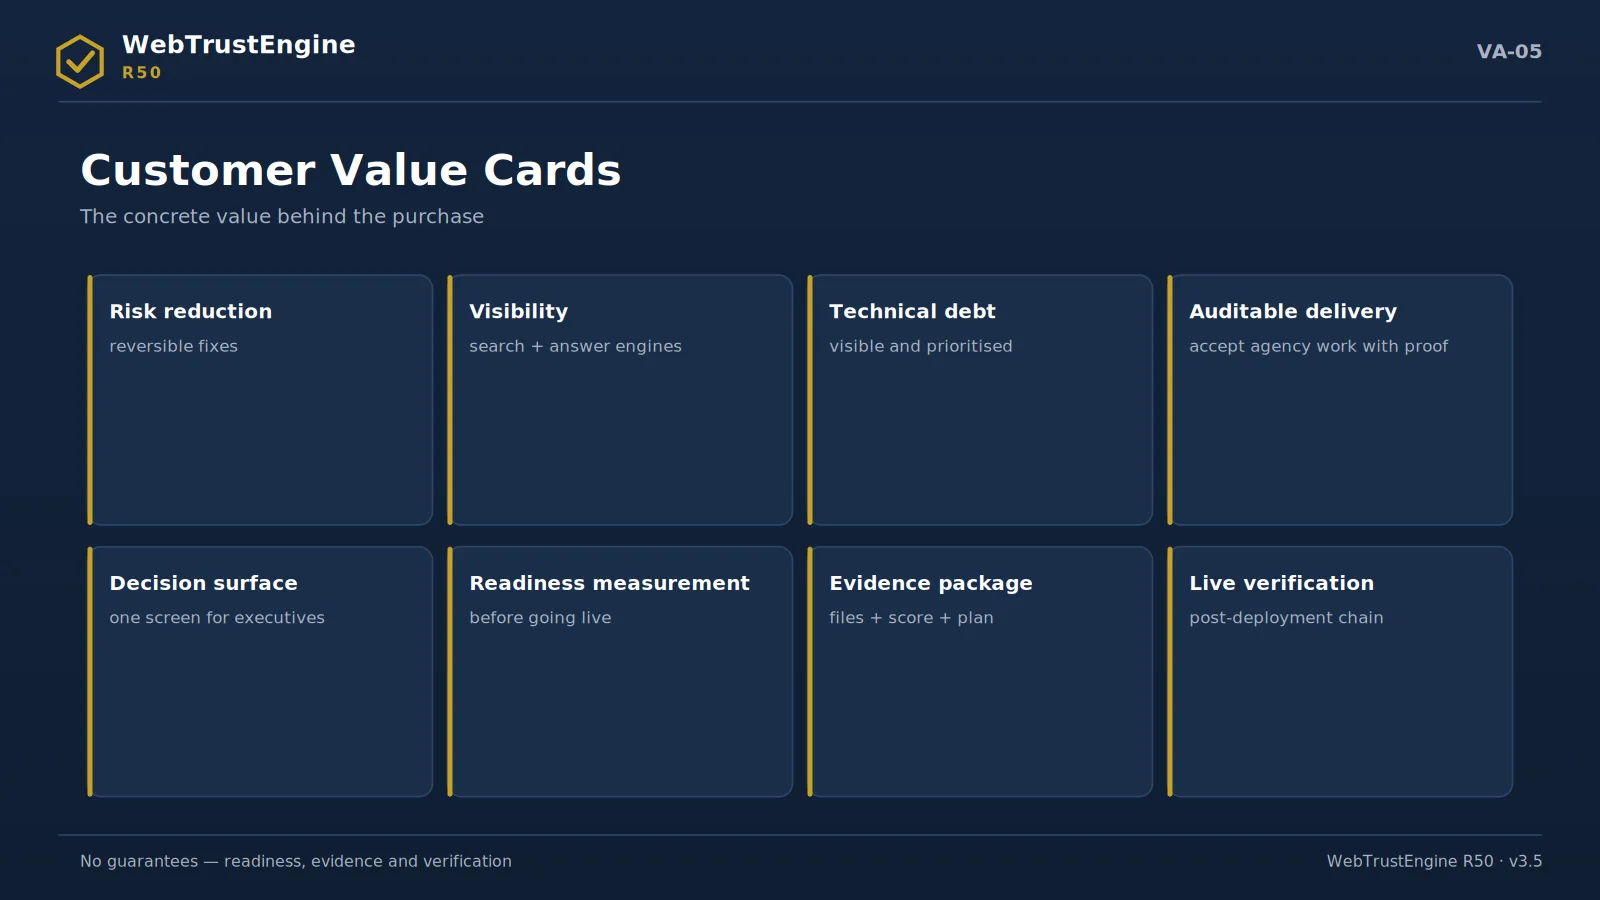
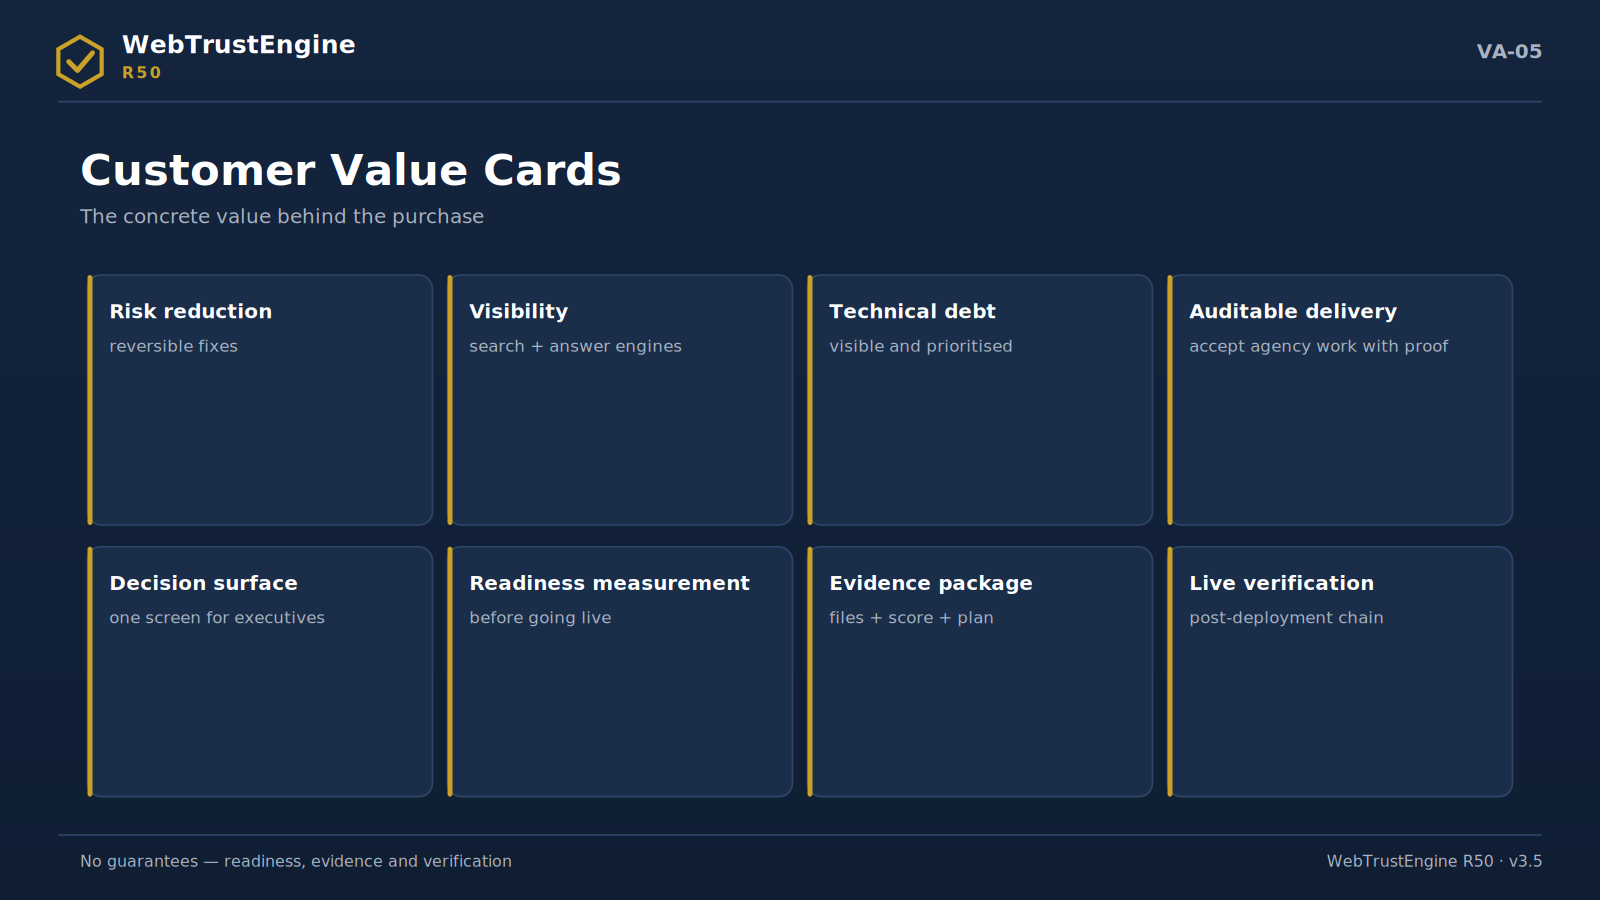
Customer value cards: eight concrete values from risk reduction to live verification.
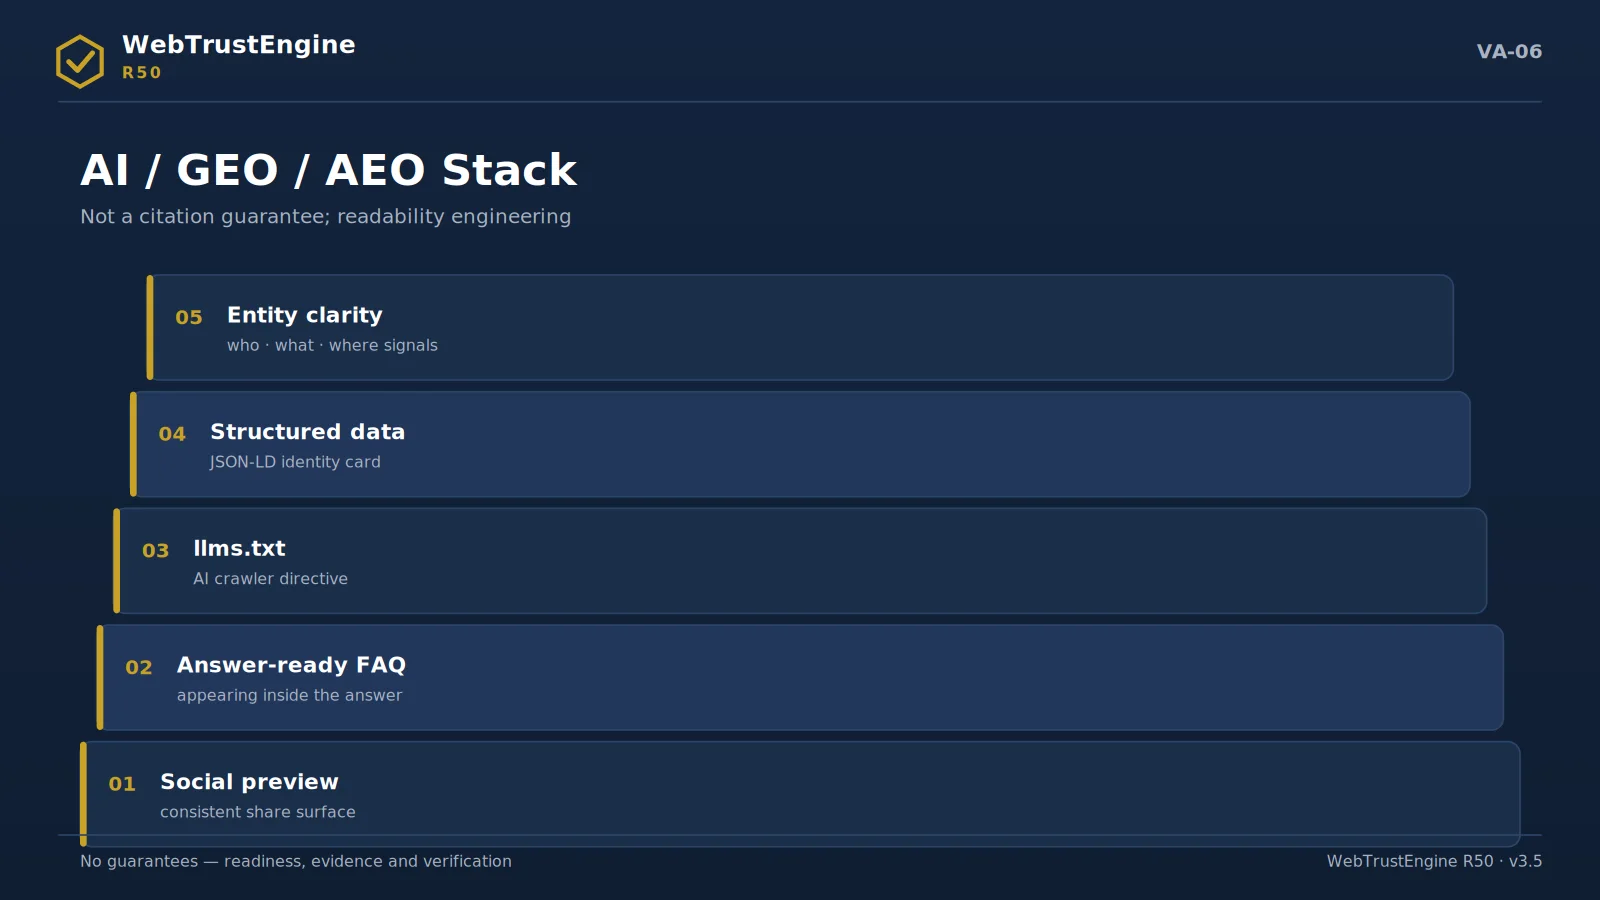
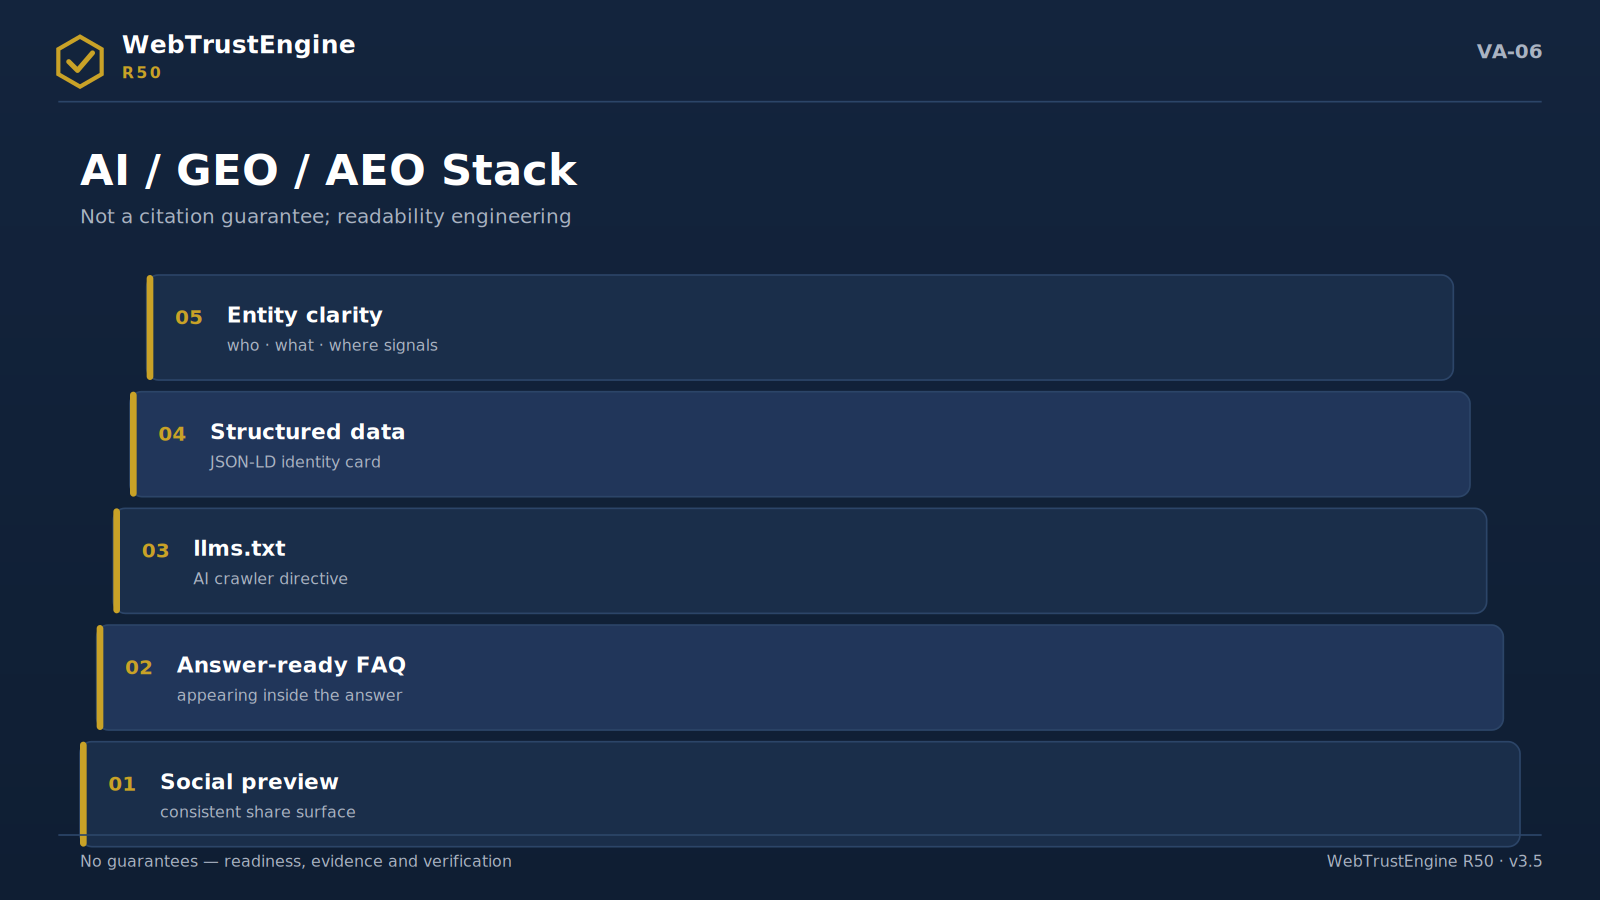
The AI/GEO/AEO readiness stack: five levels from identity to answer-ready content.

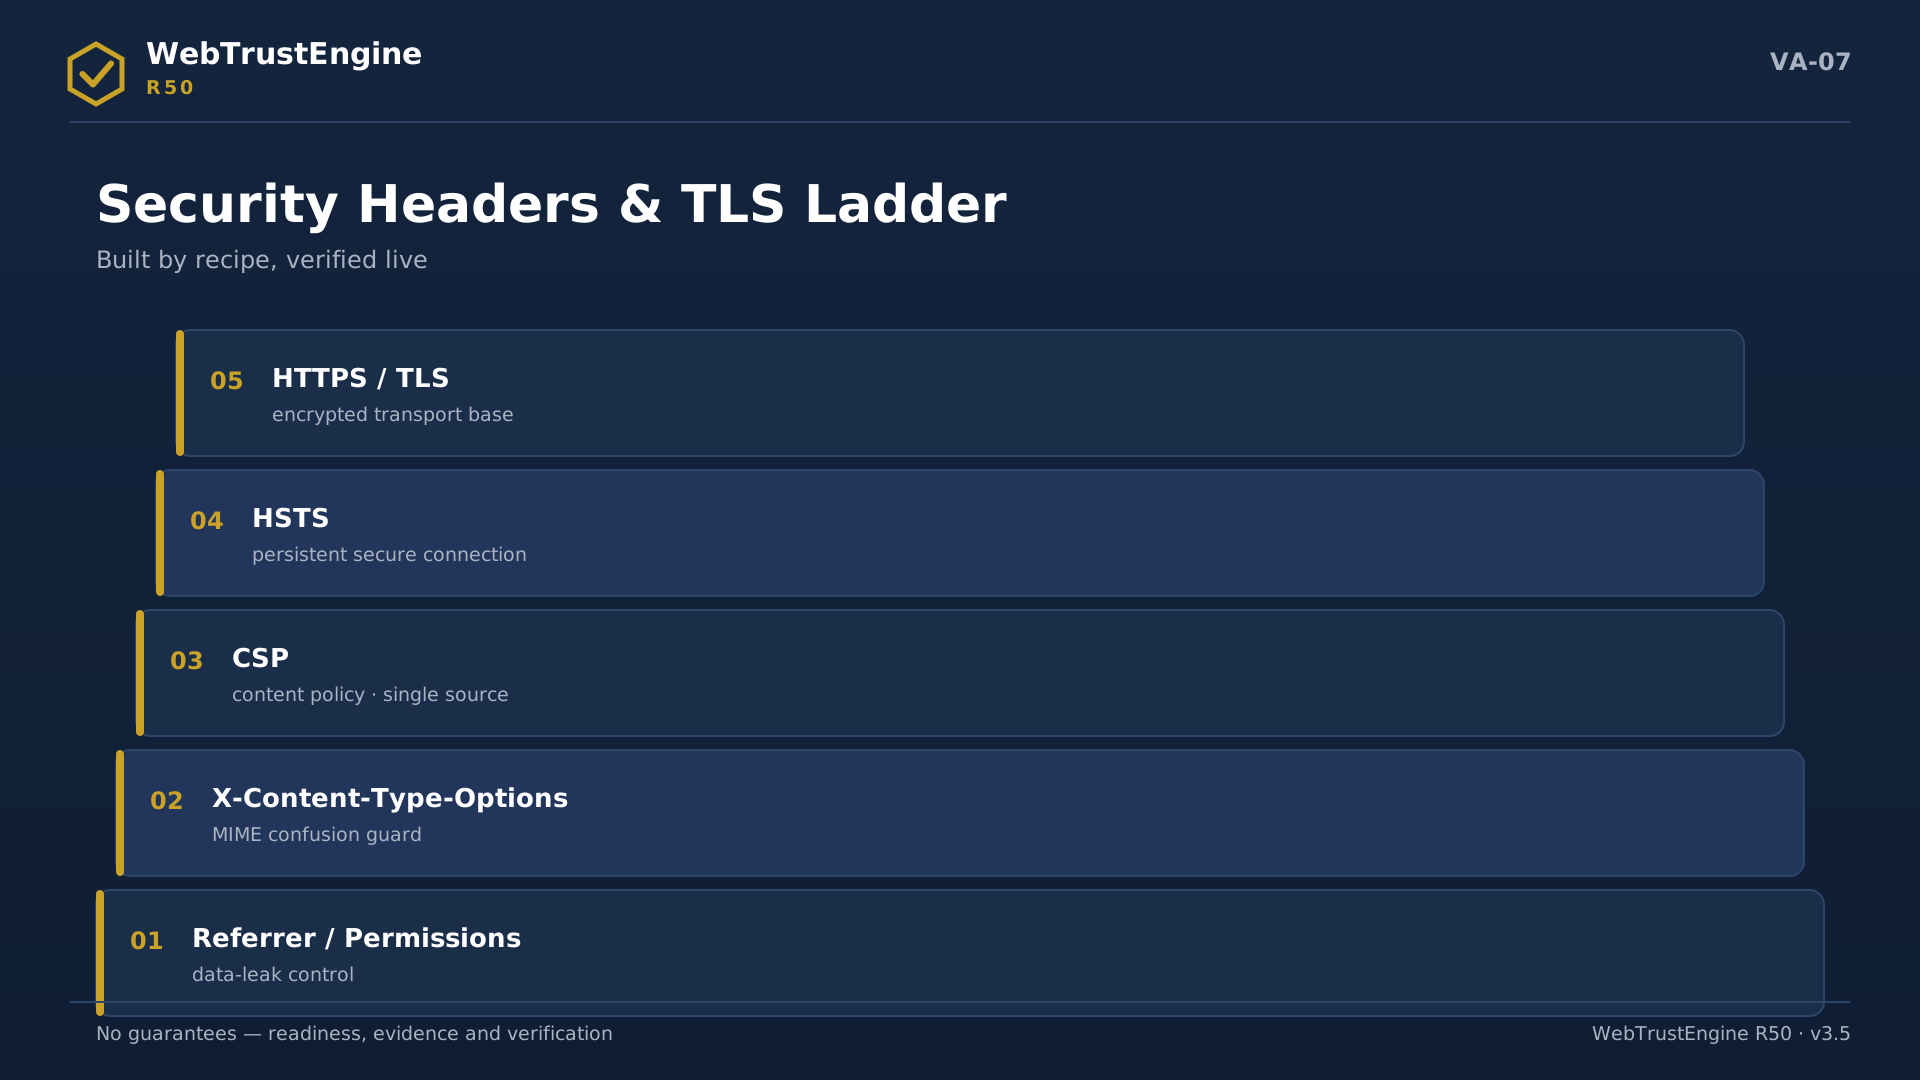
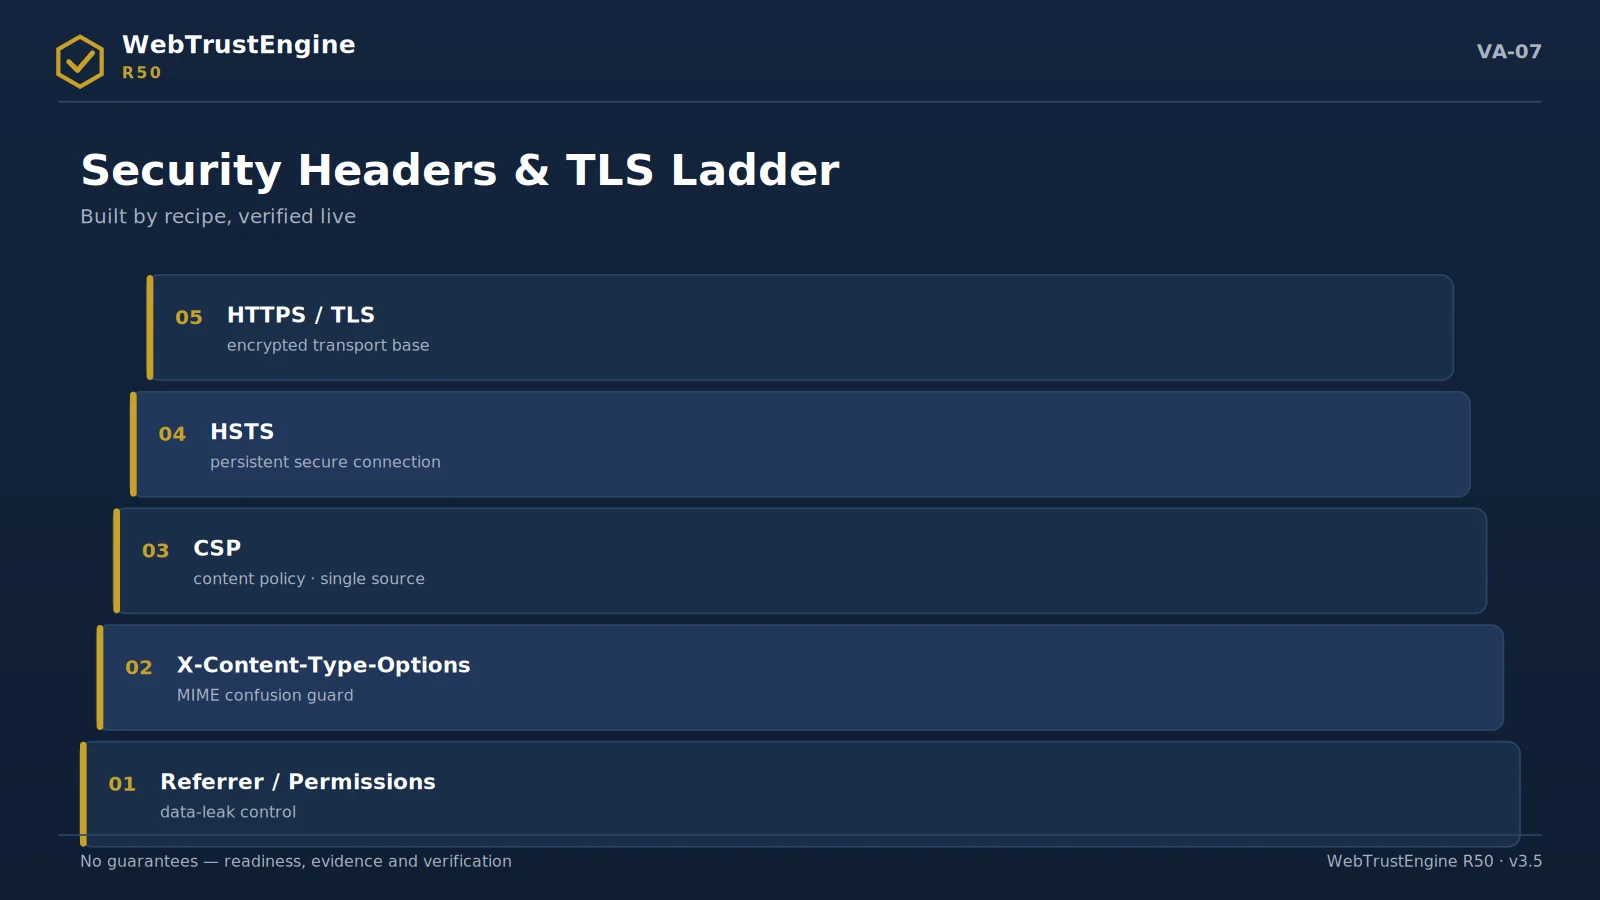
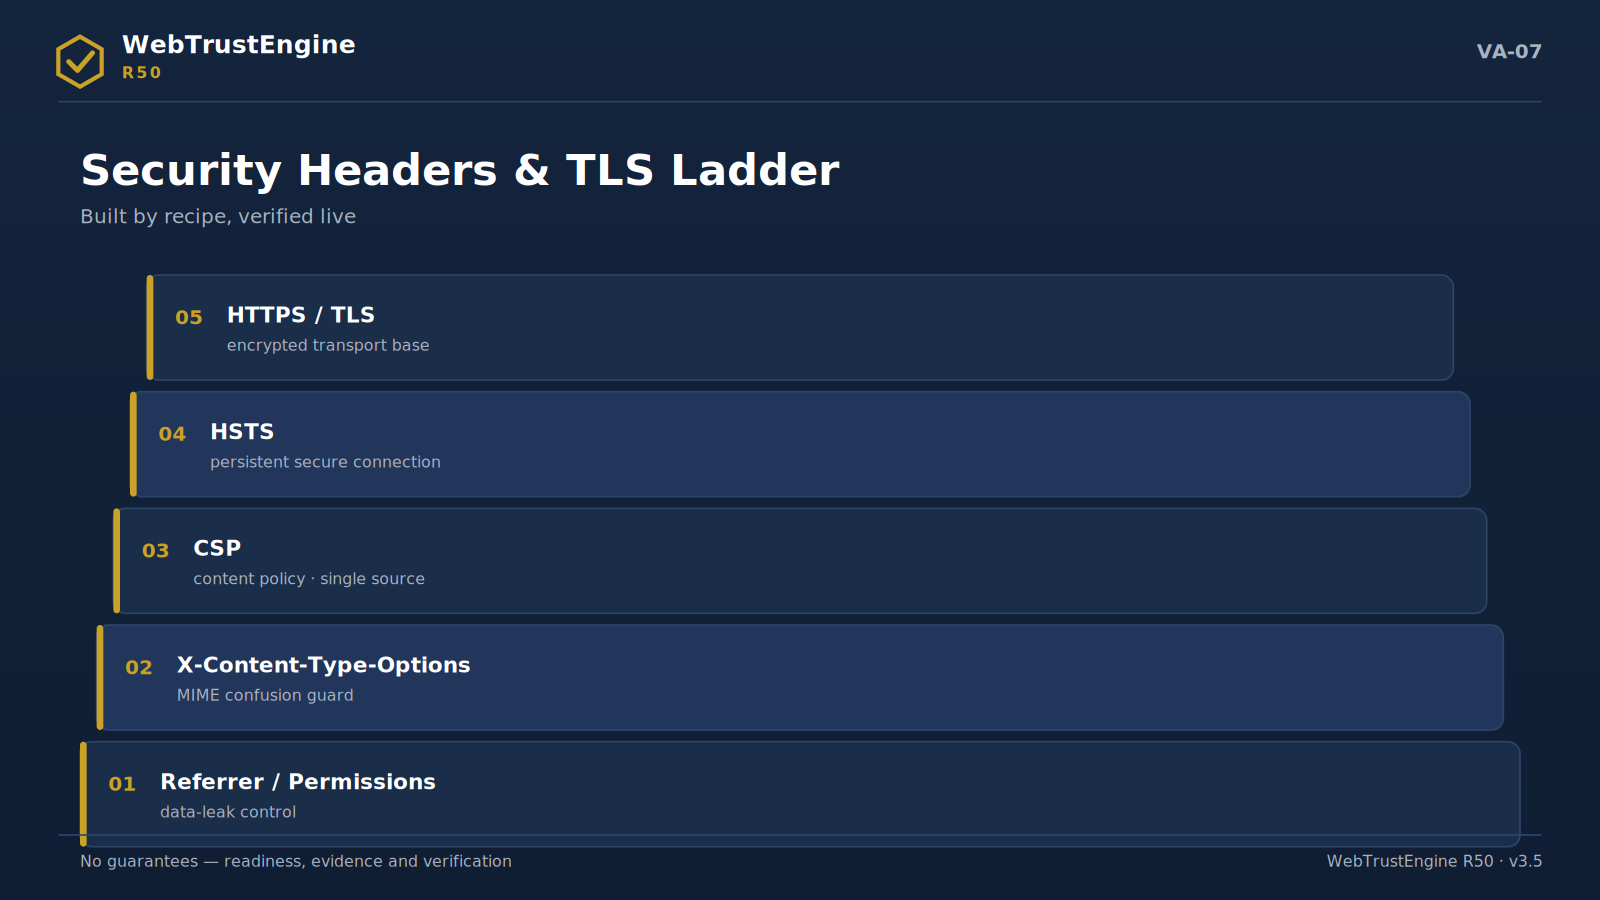
The security headers and TLS ladder: from base transport to policy layer.
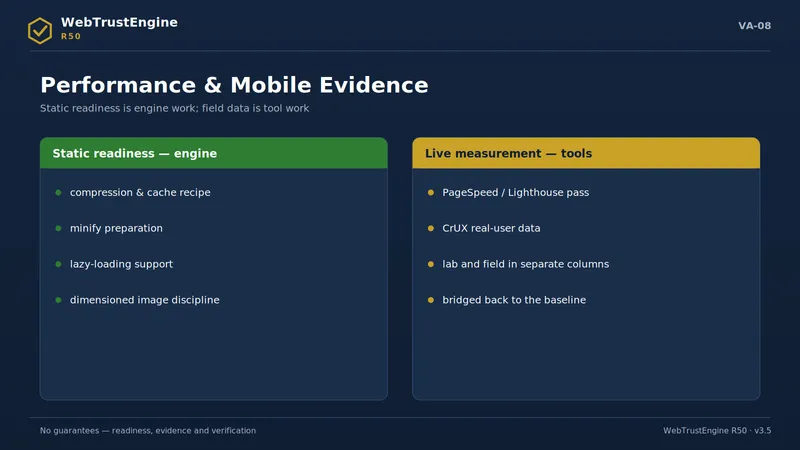
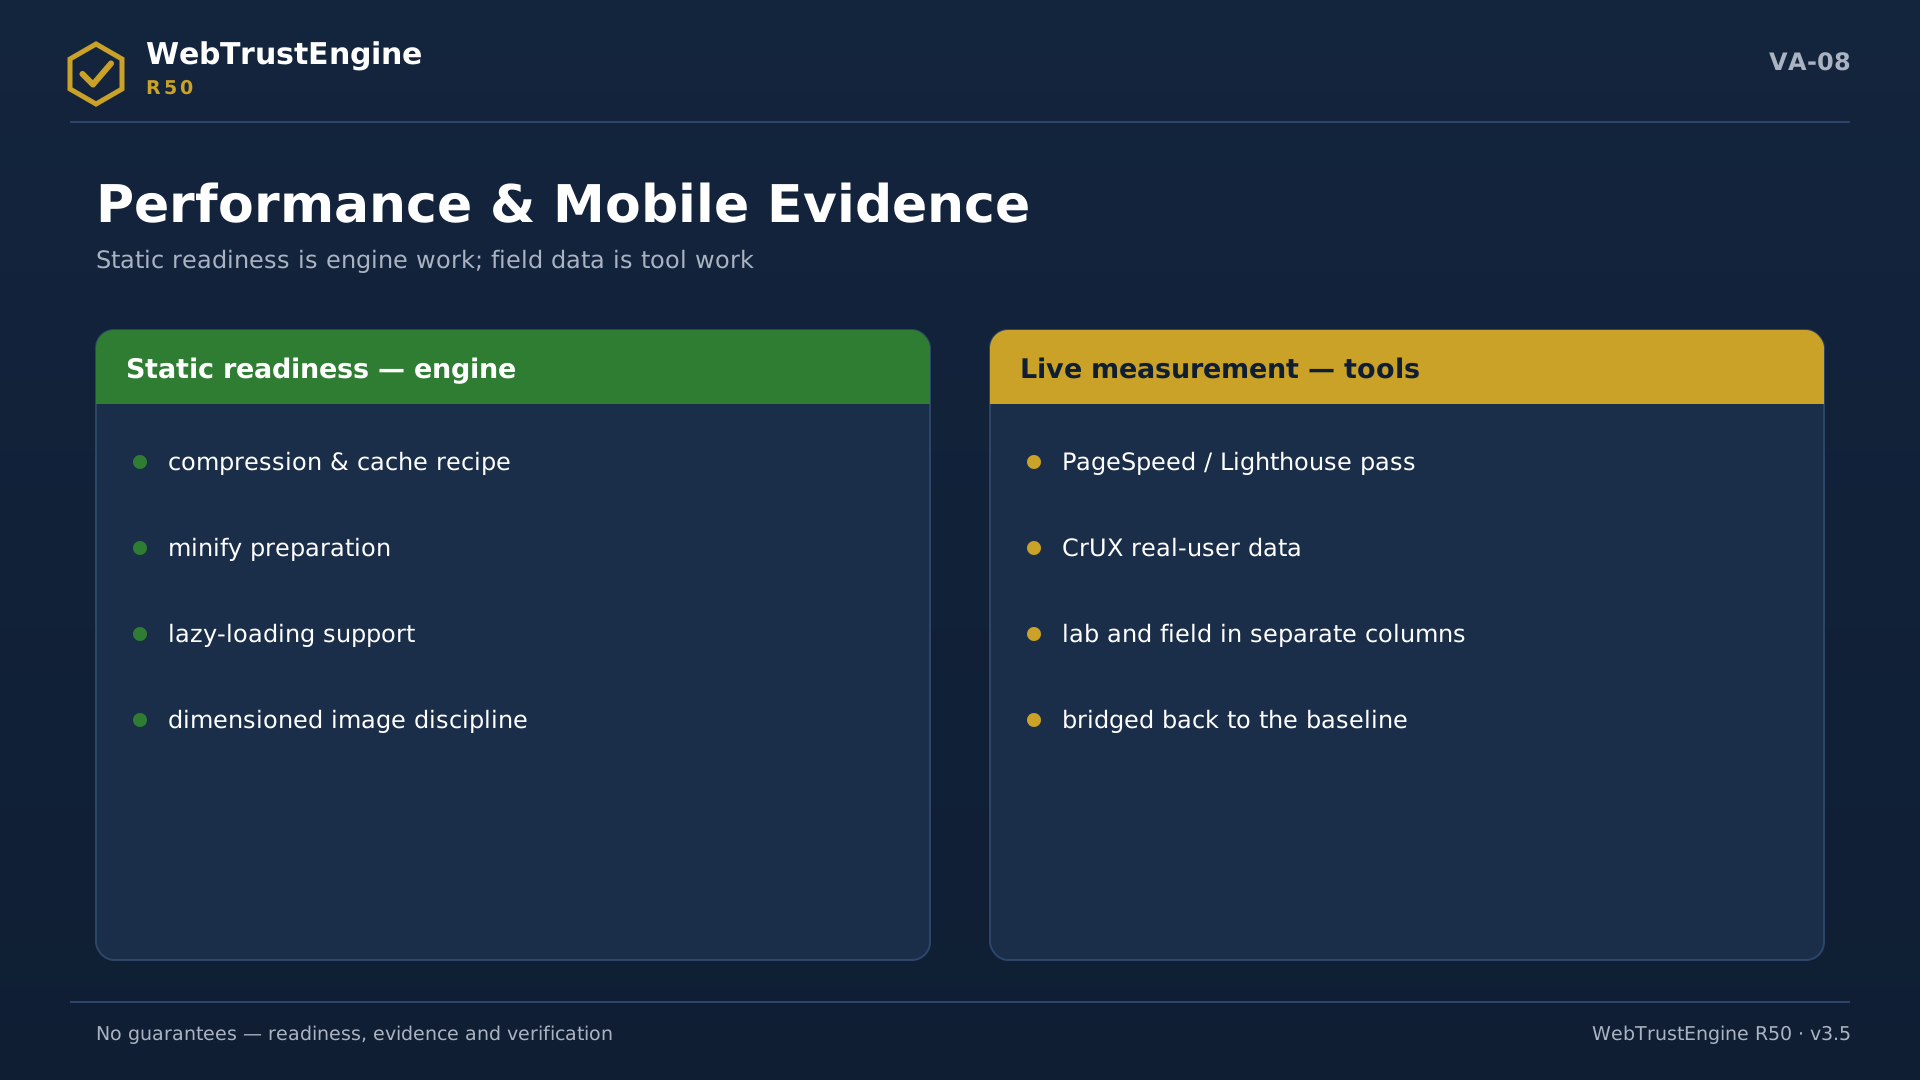
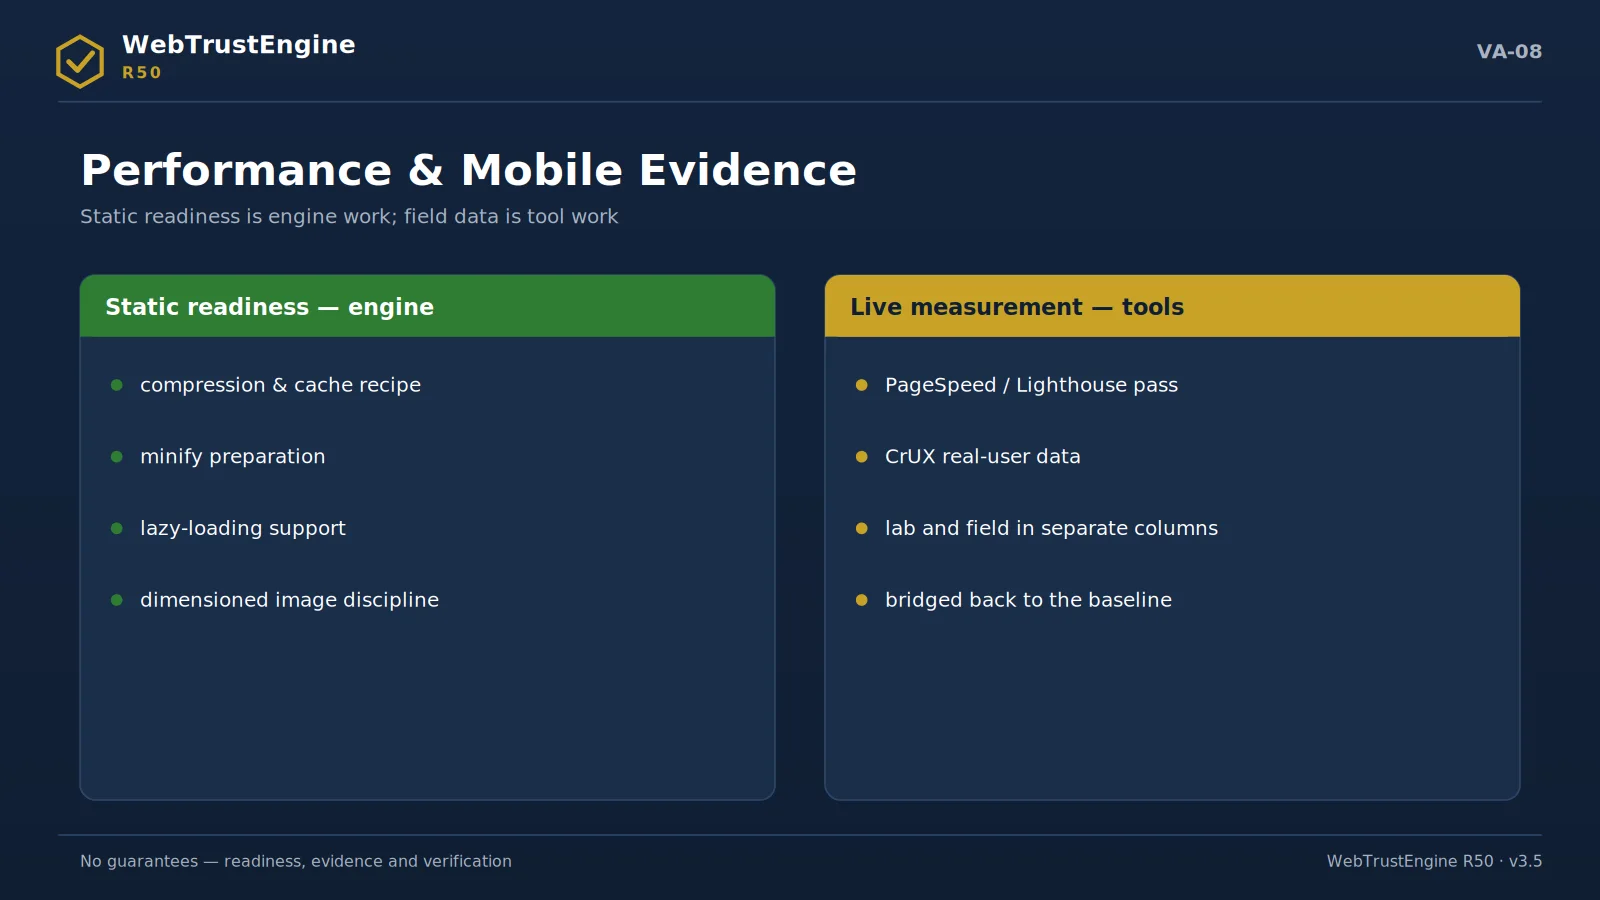
Performance evidence on two shores: static readiness in the engine, live measurement in independent tools.
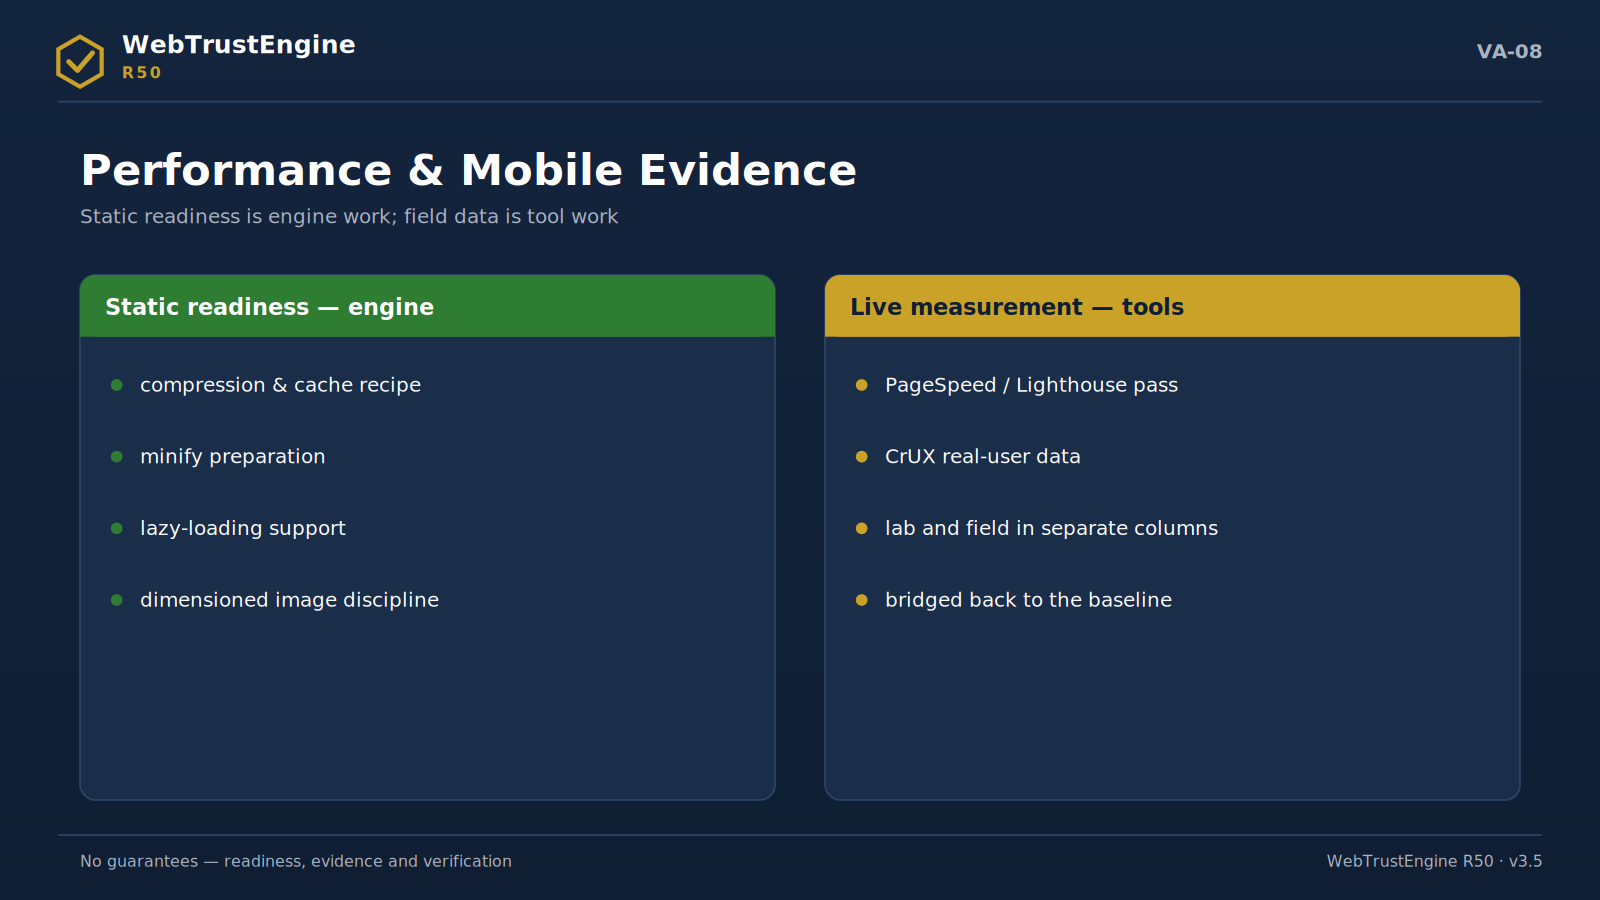
Performance evidence on two shores: static readiness in the engine, live measurement in independent tools.
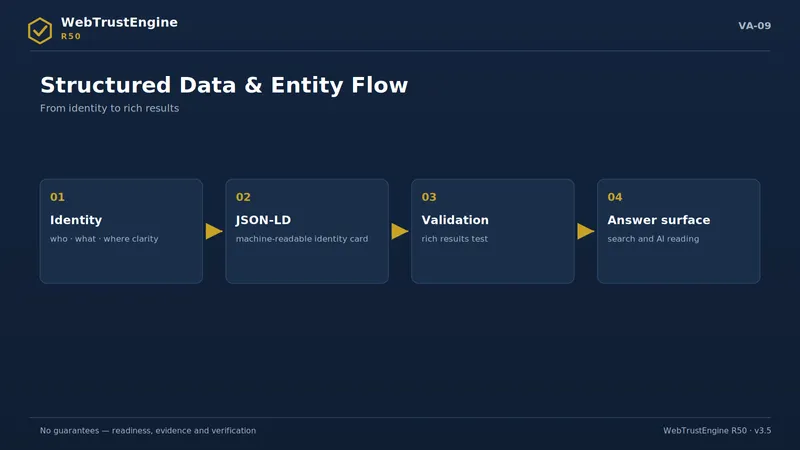
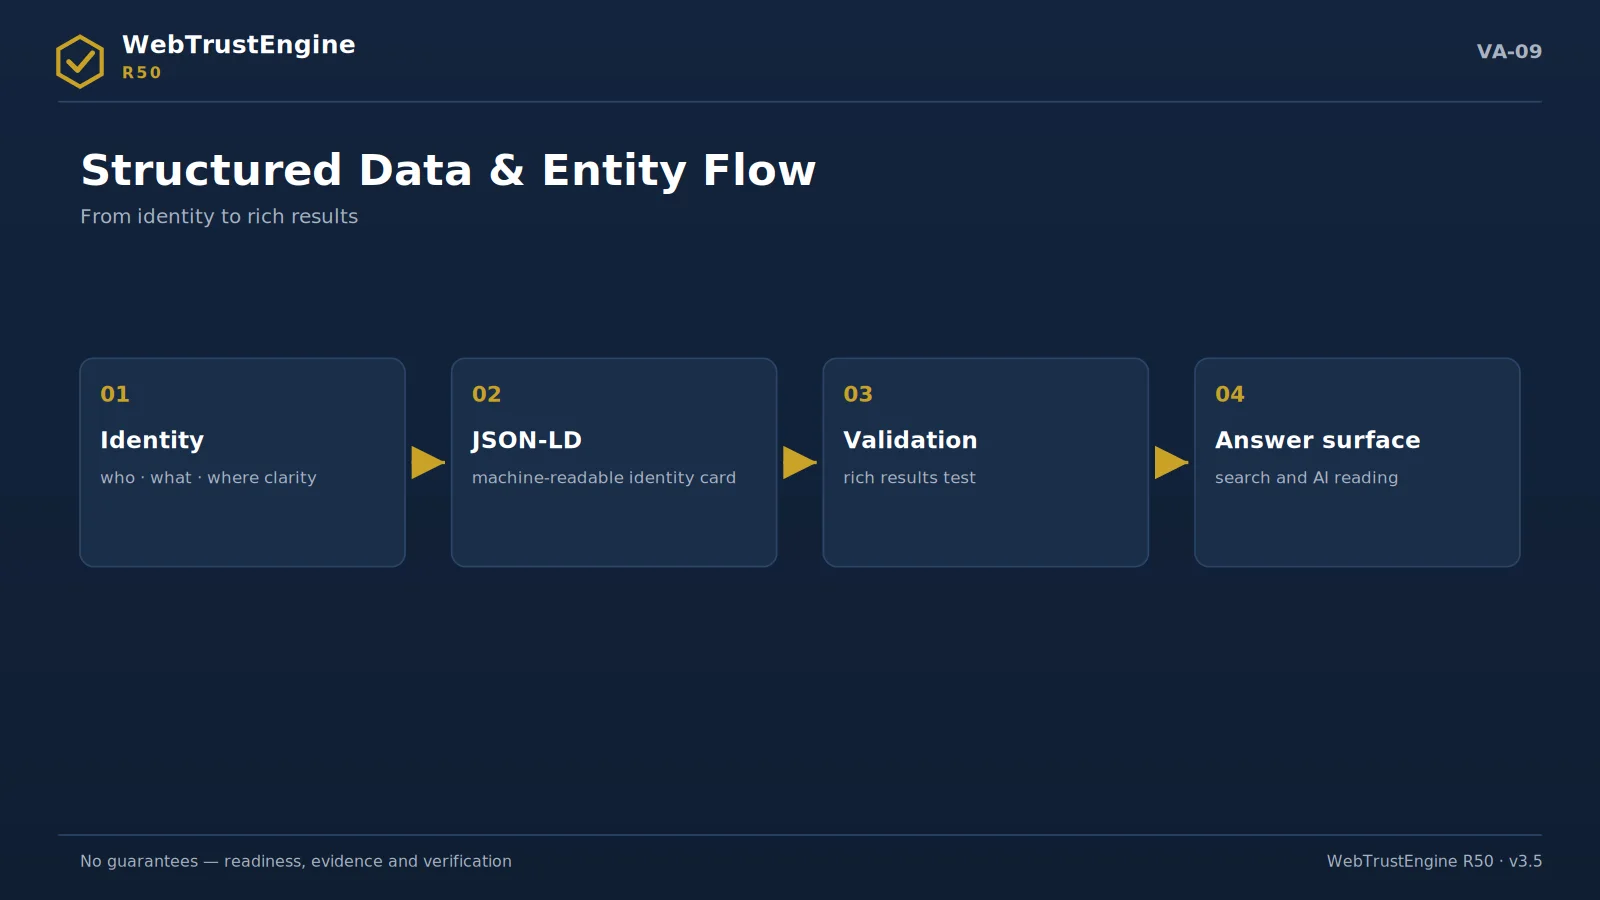
The entity flow: from identity clarity to machine-readable identity and a validated answer surface.
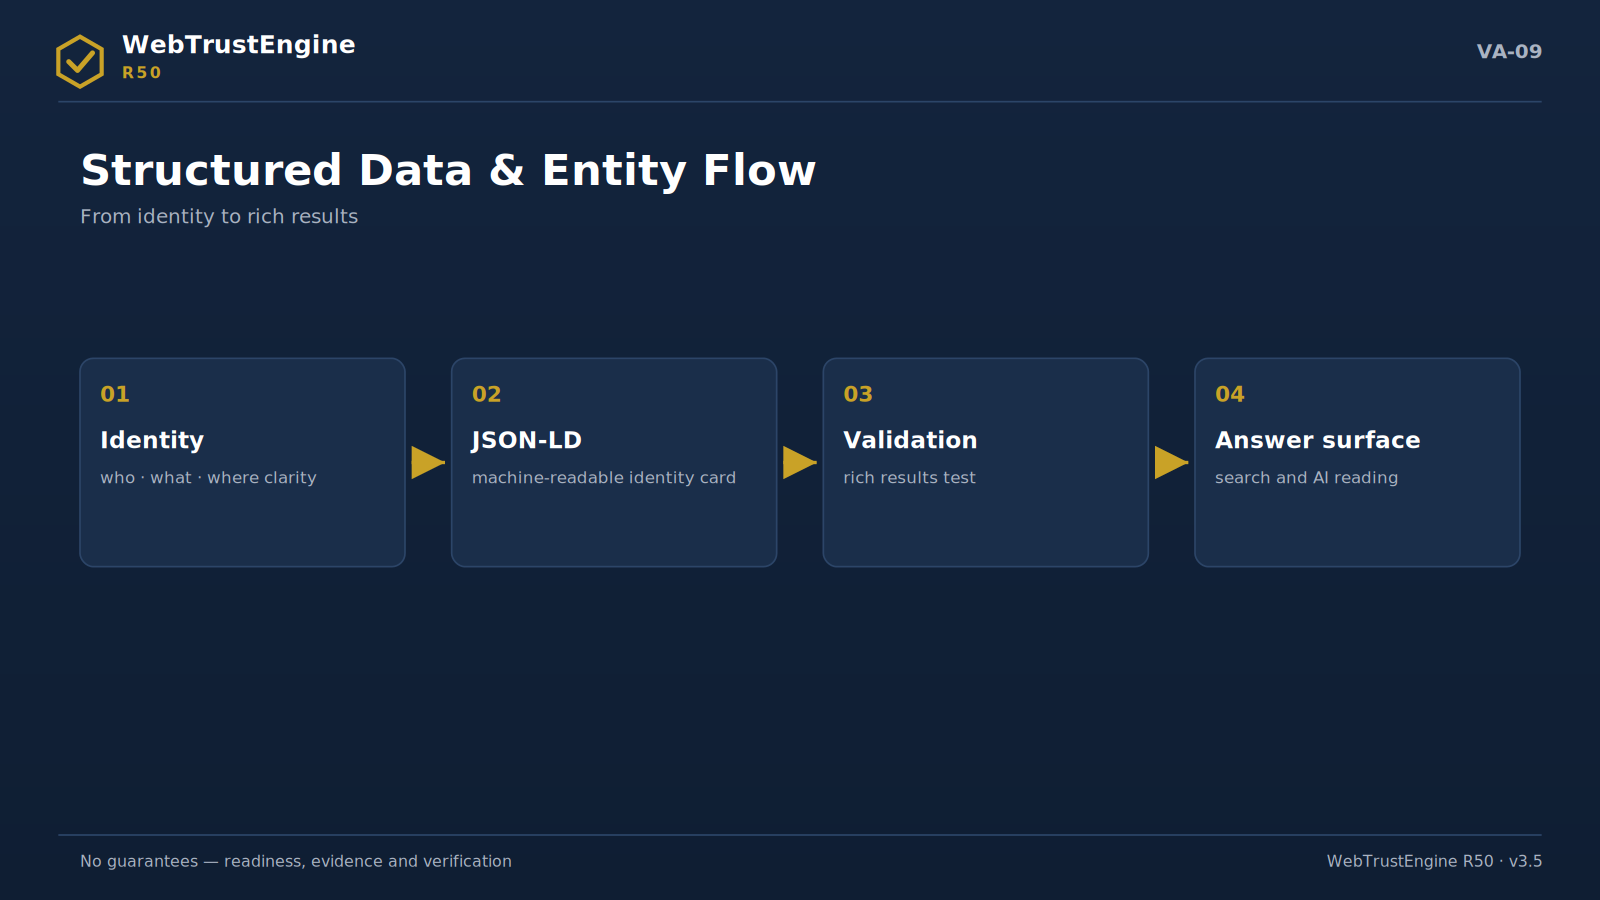
The entity flow: from identity clarity to machine-readable identity and a validated answer surface.

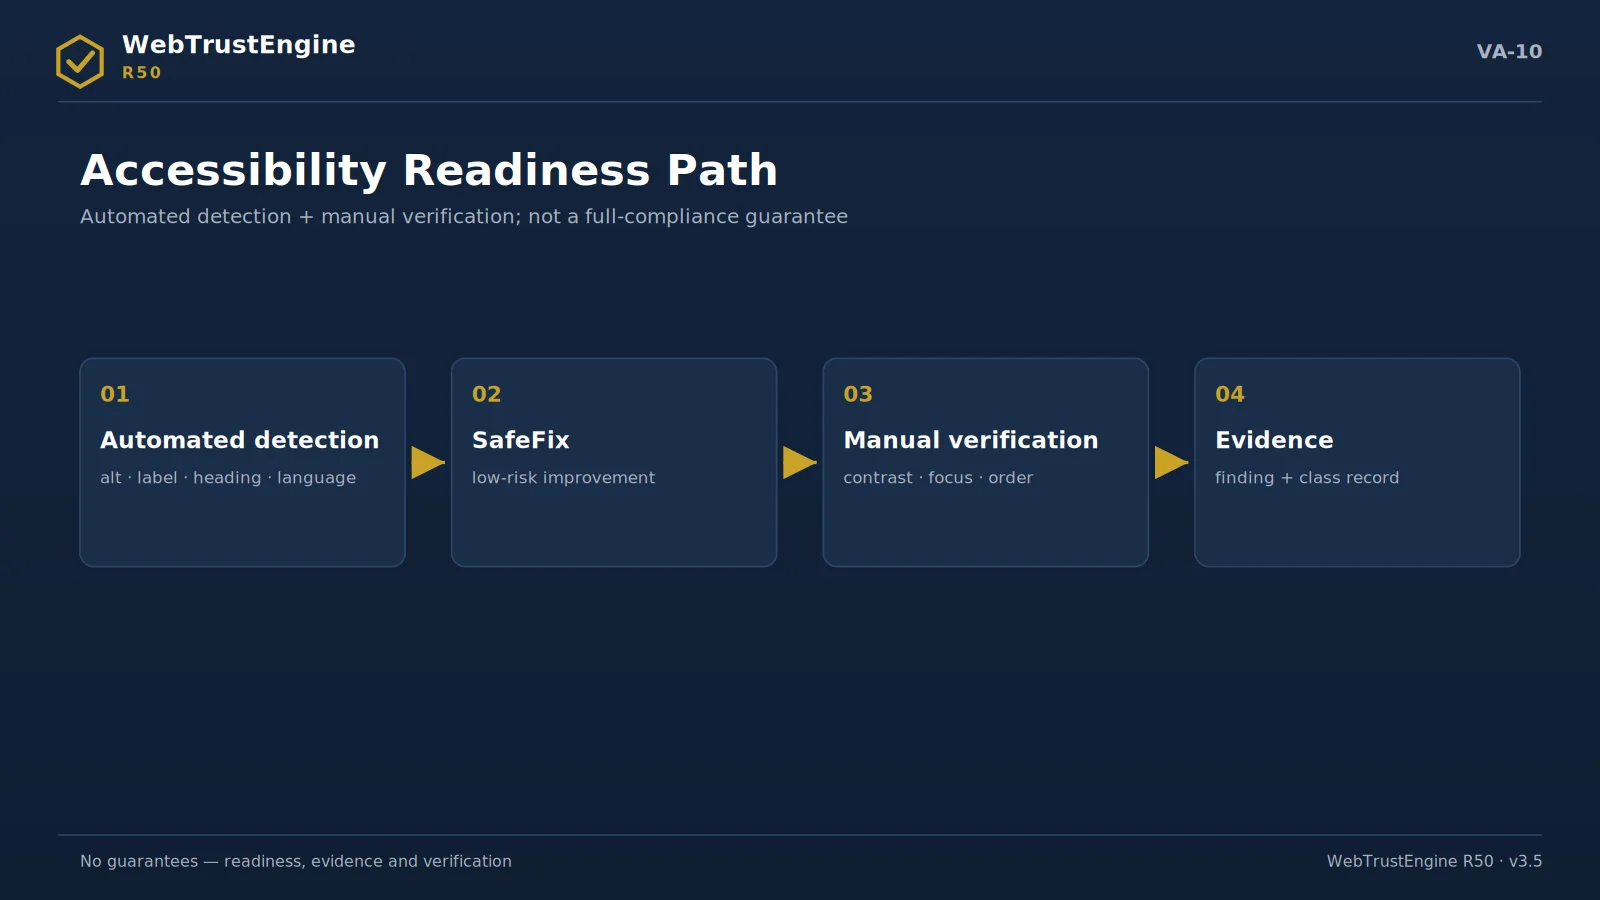
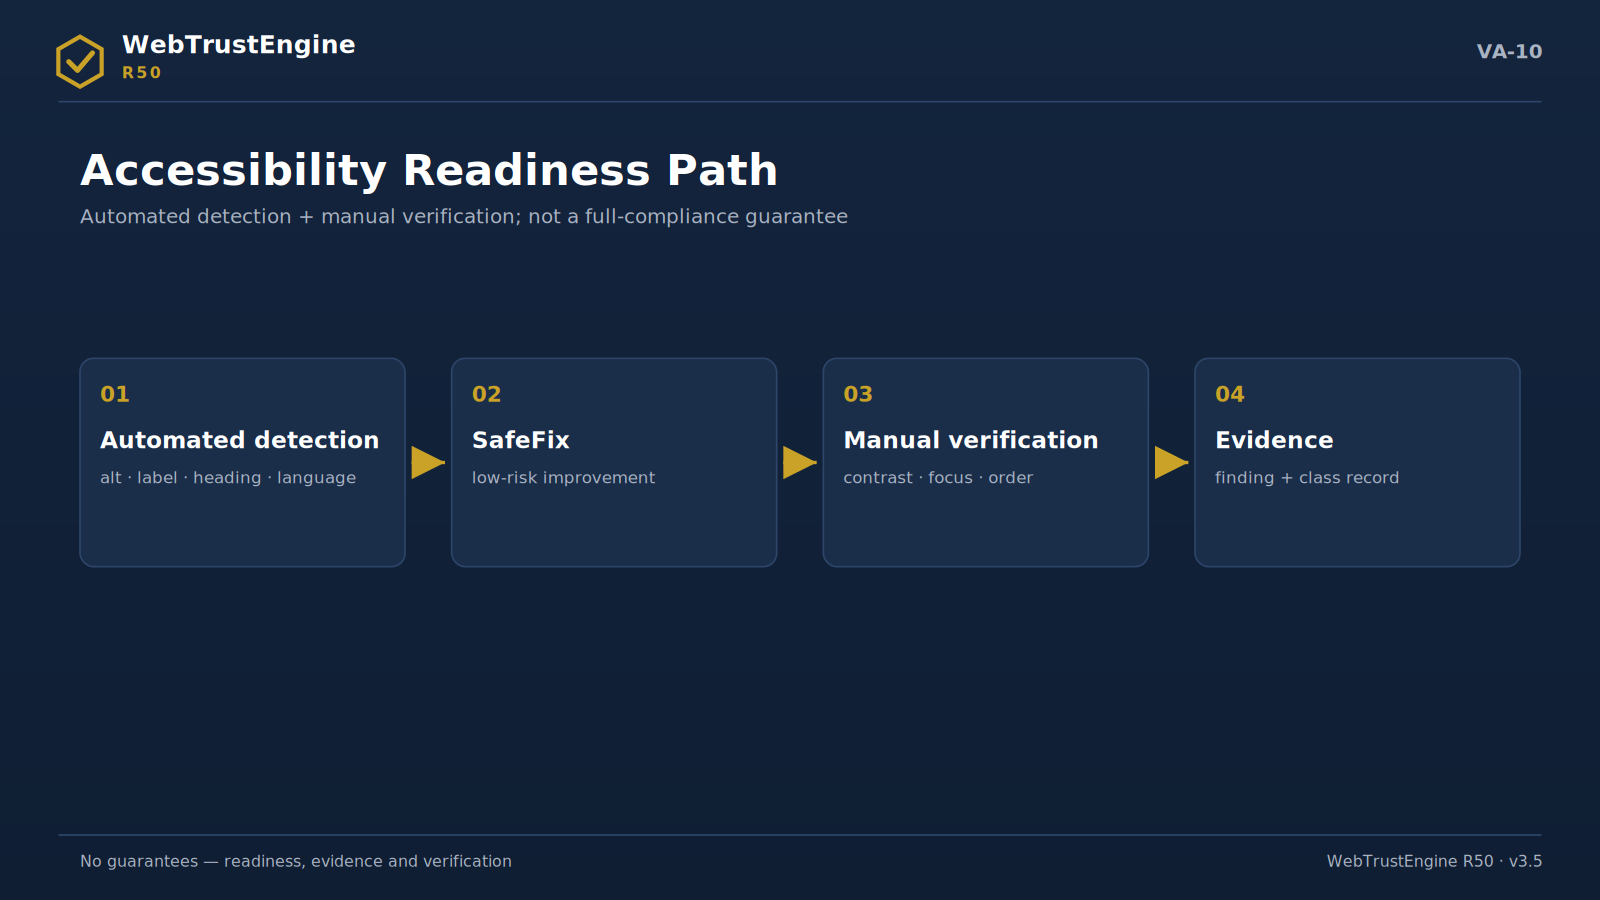
The accessibility path: from automated detection to outside automated scope.
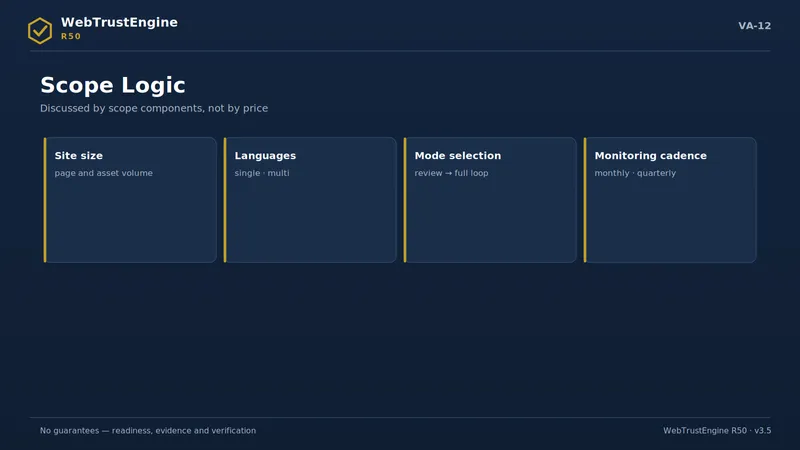
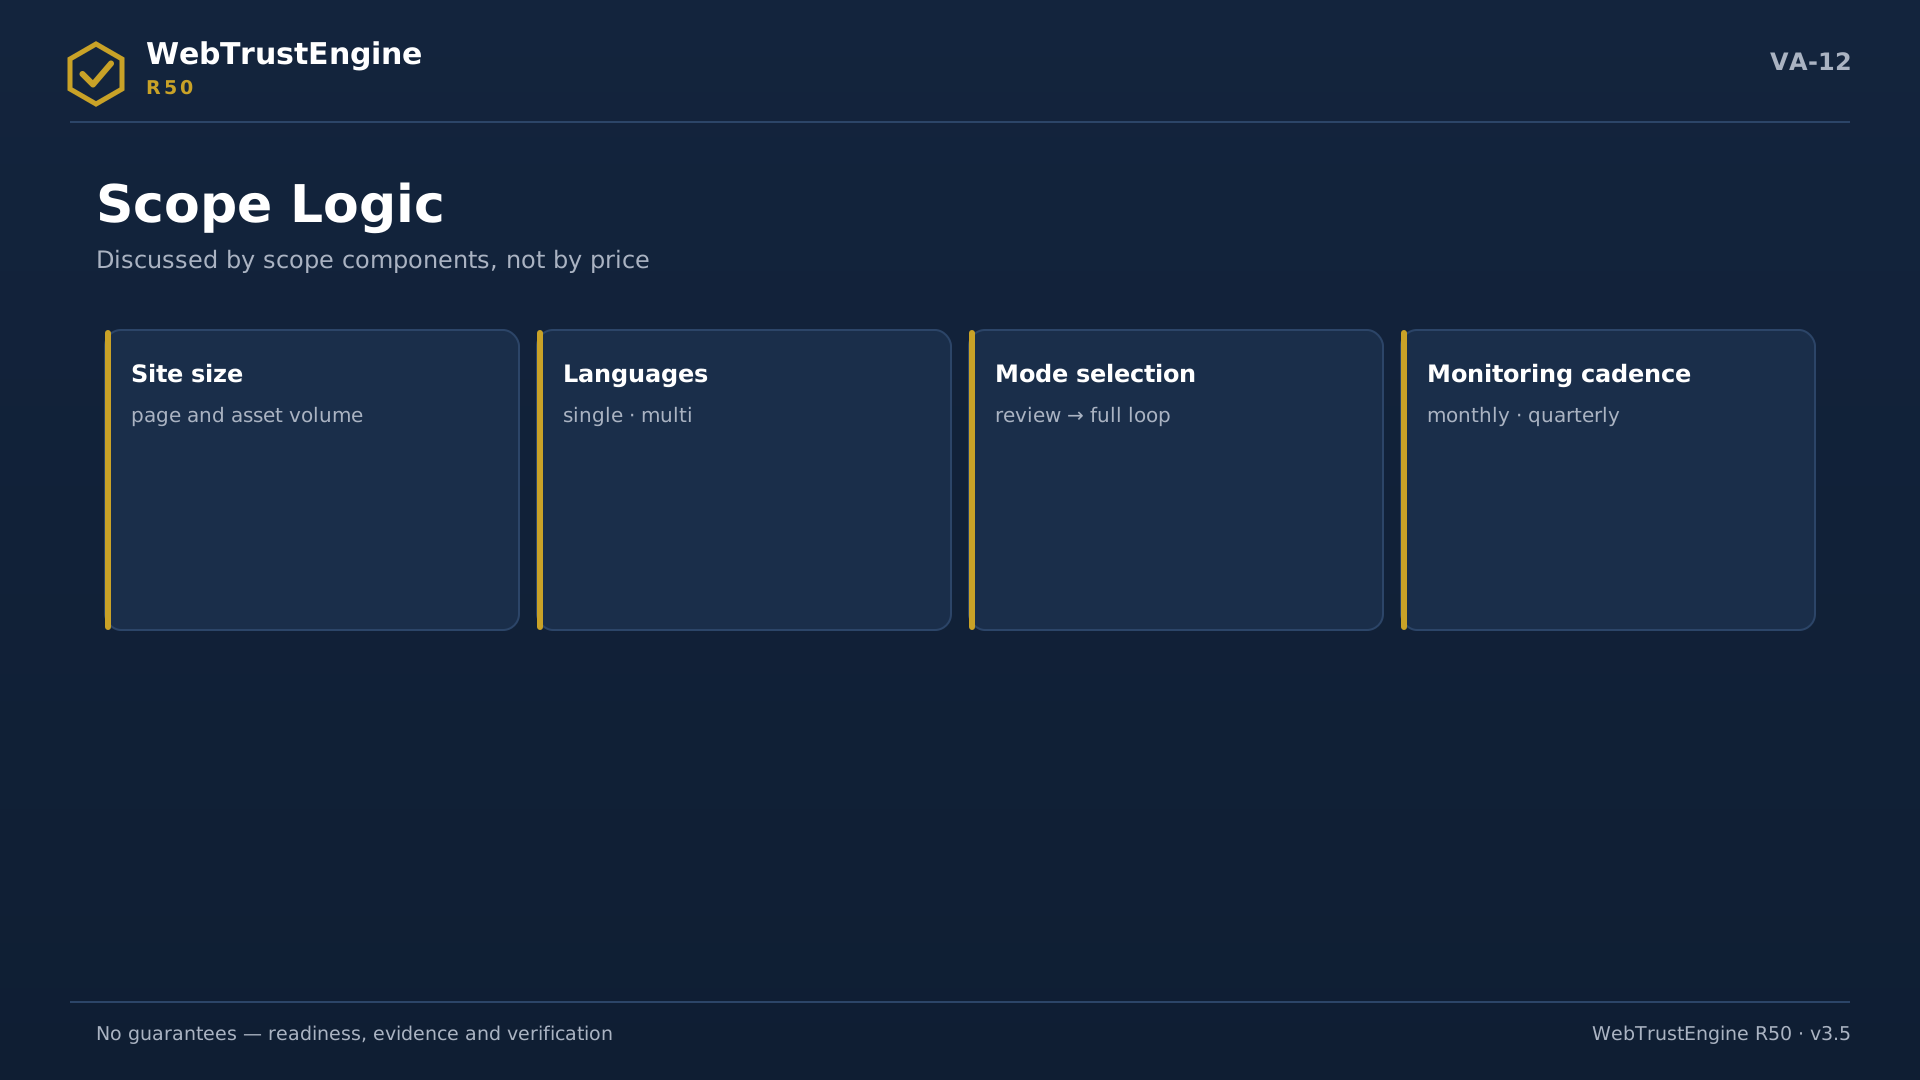
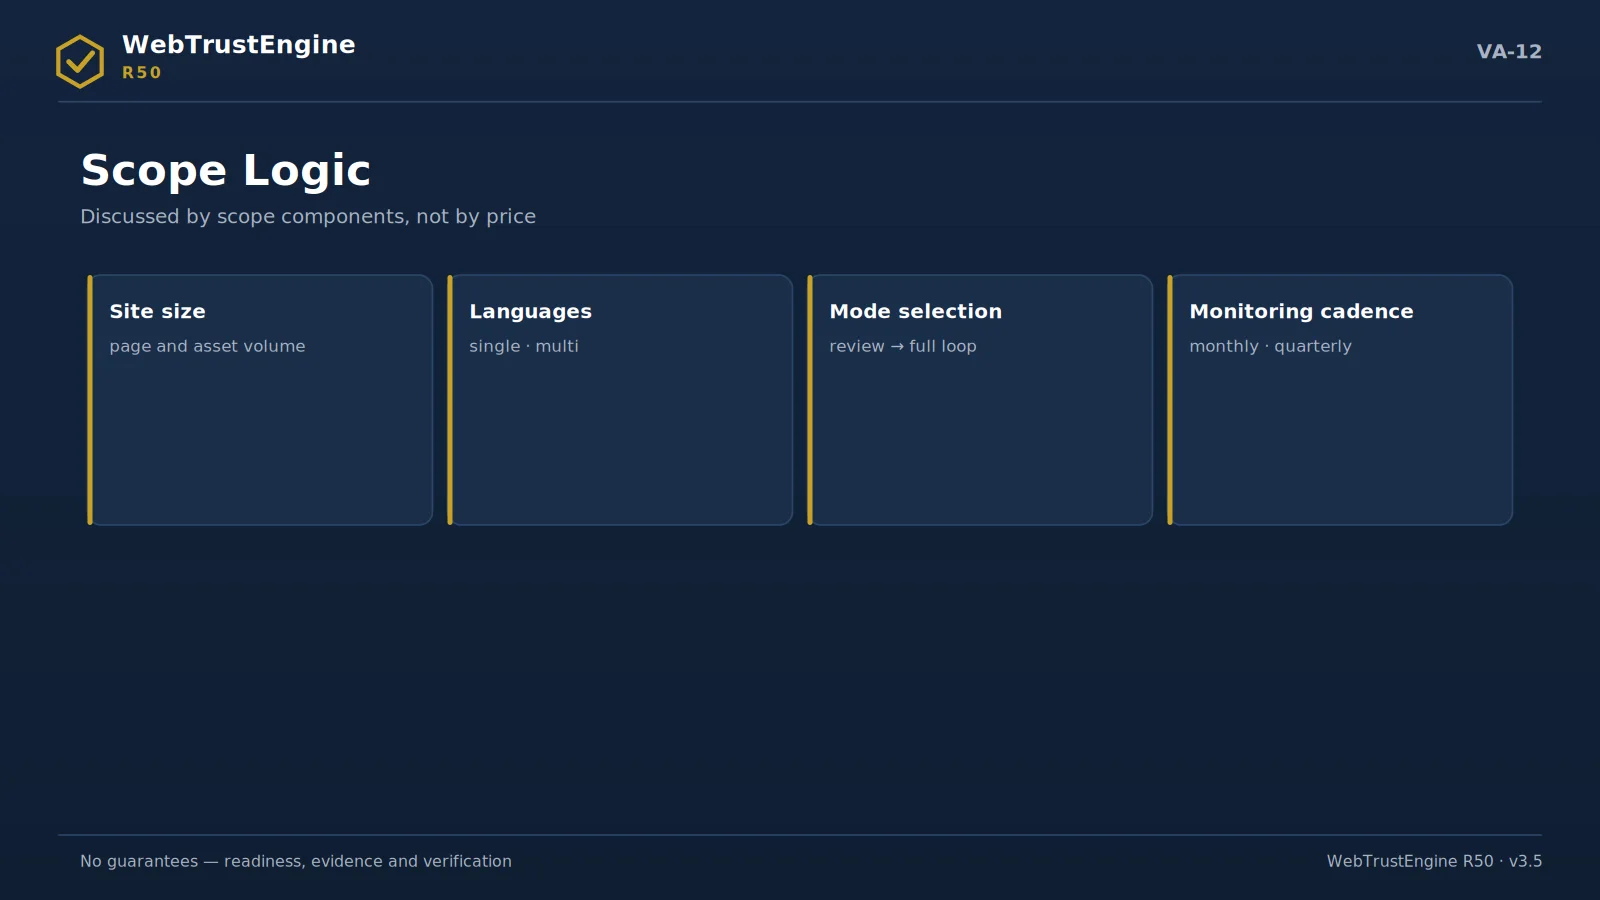
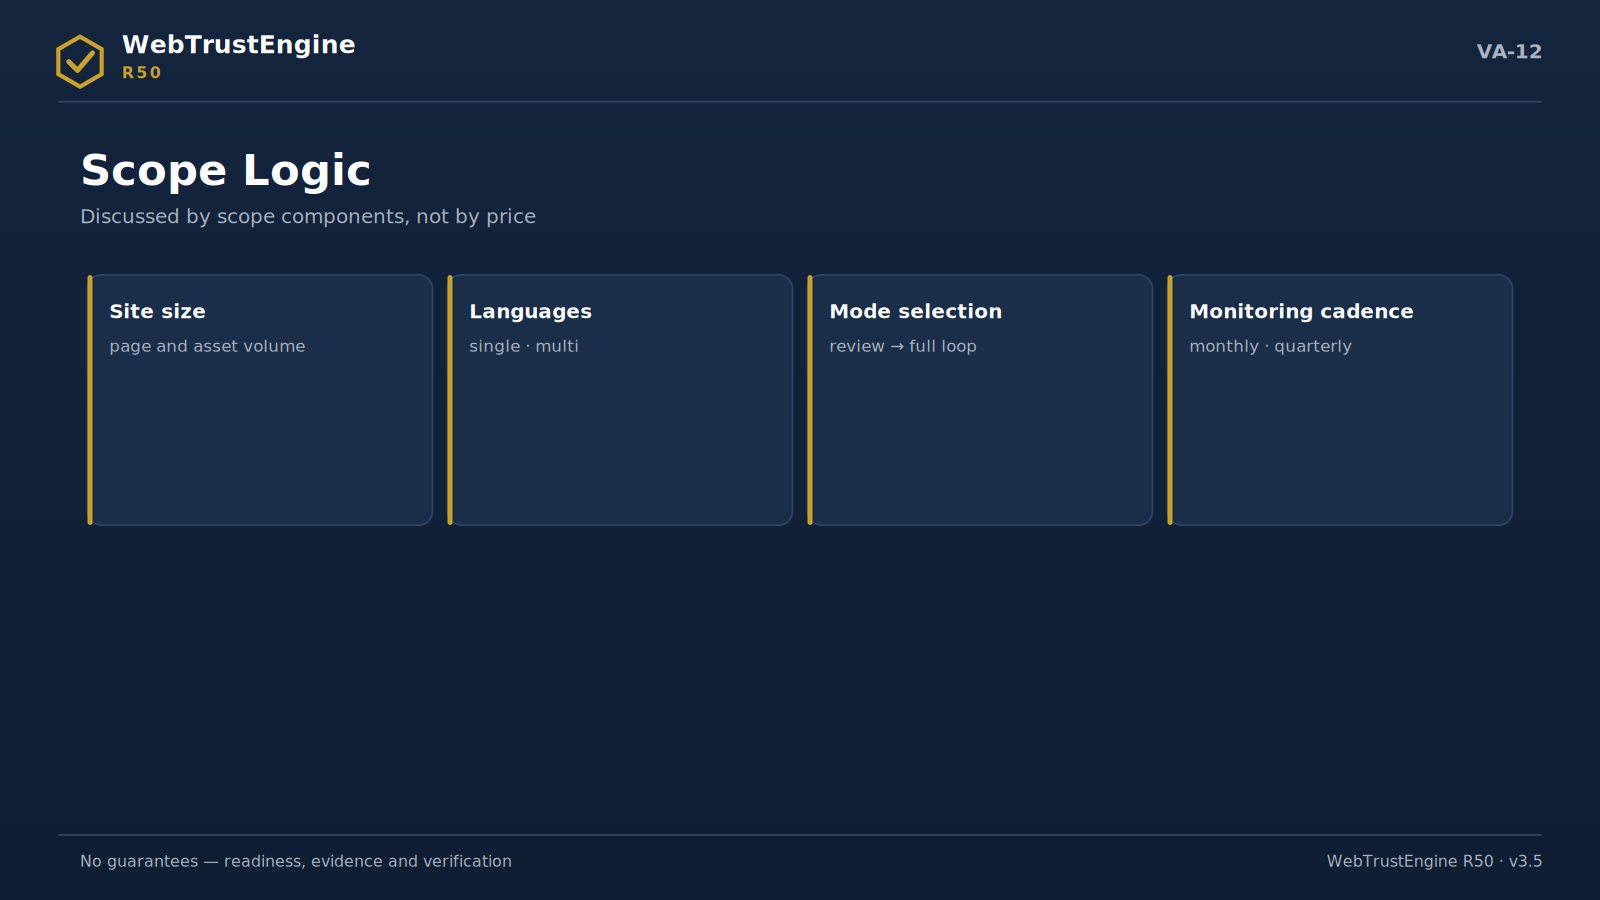
Scope logic: size, languages, modes and monitoring cadence.
Numbers, scope and limits

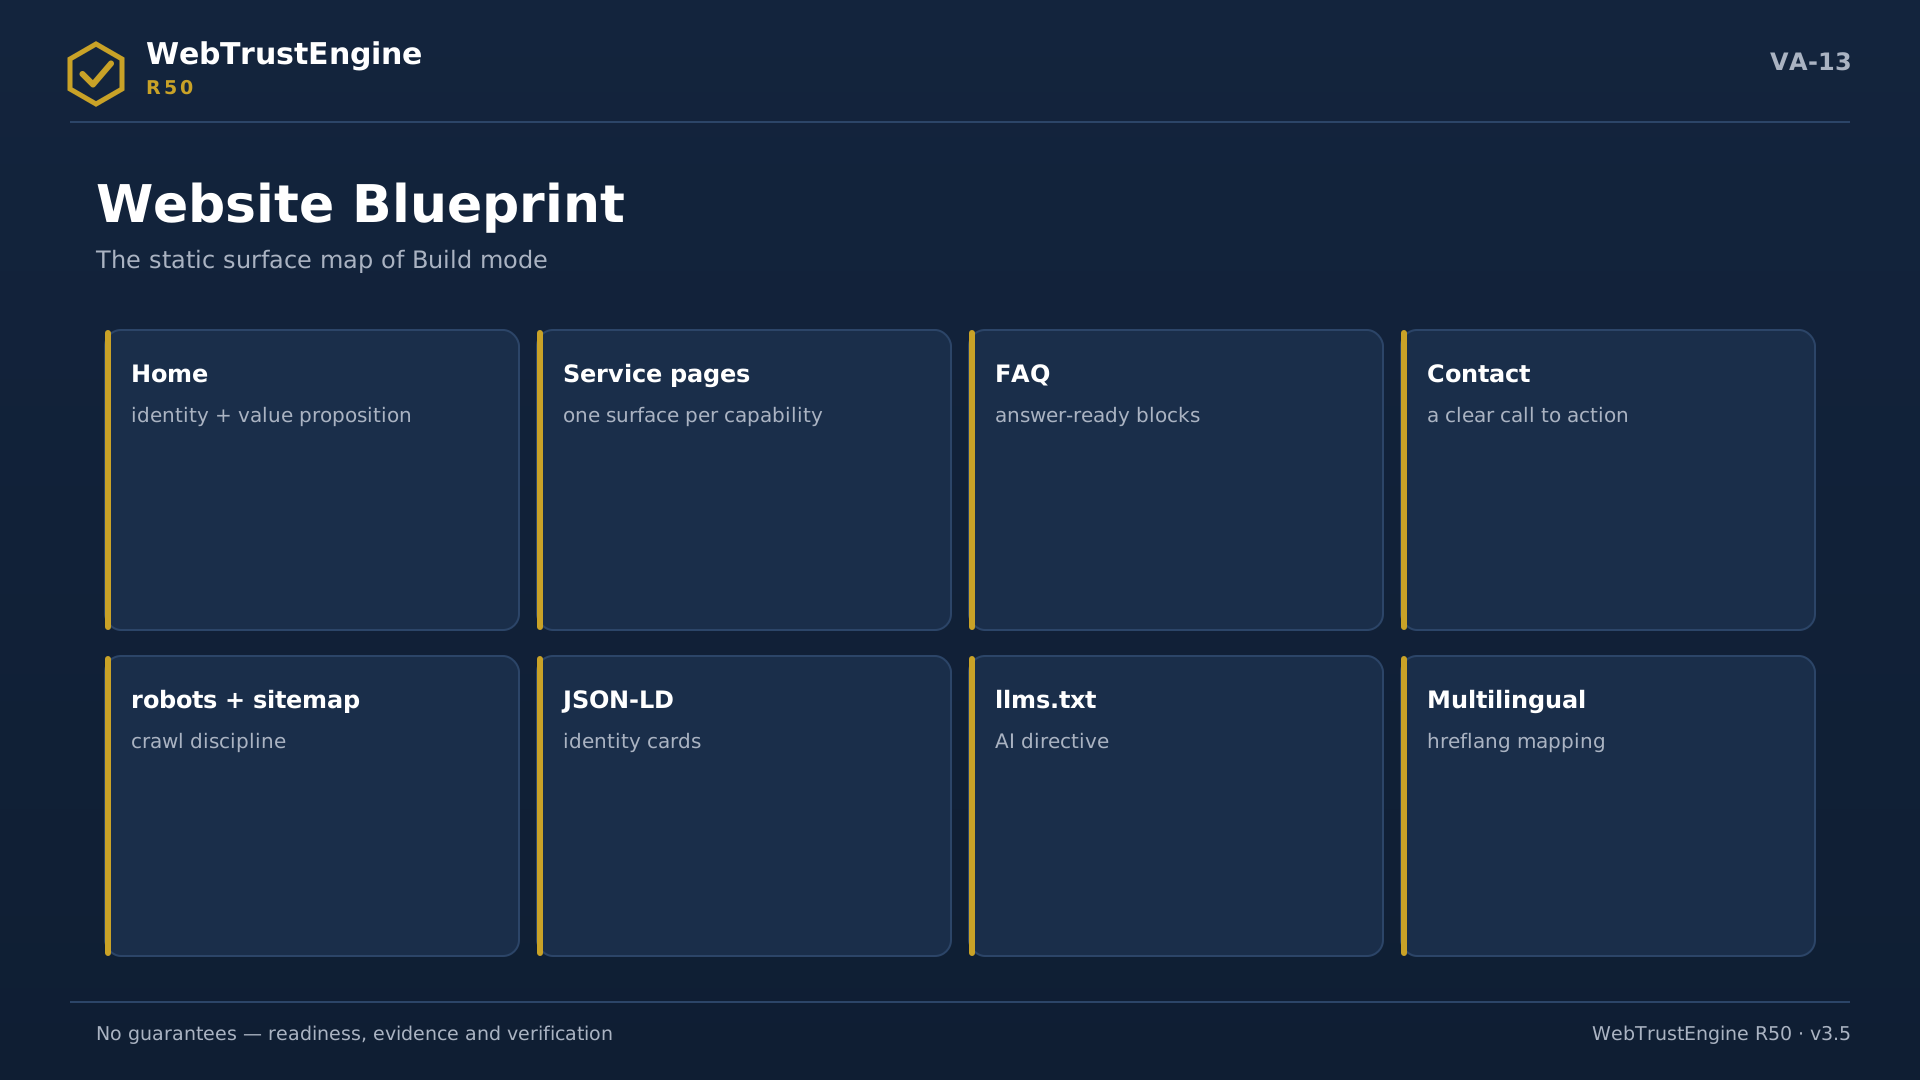
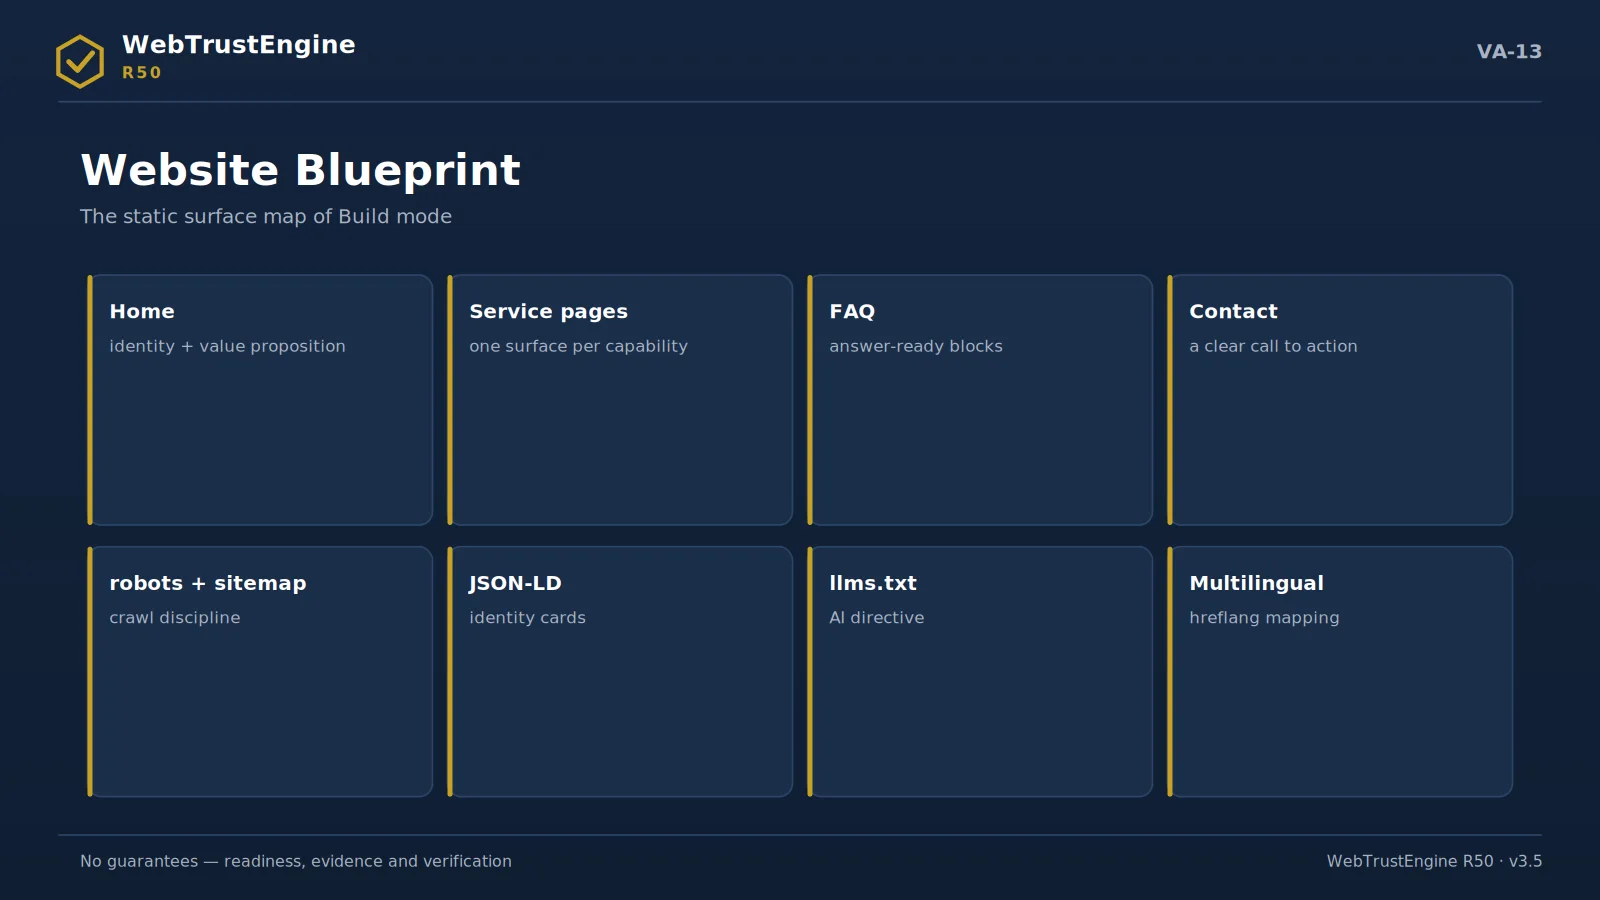
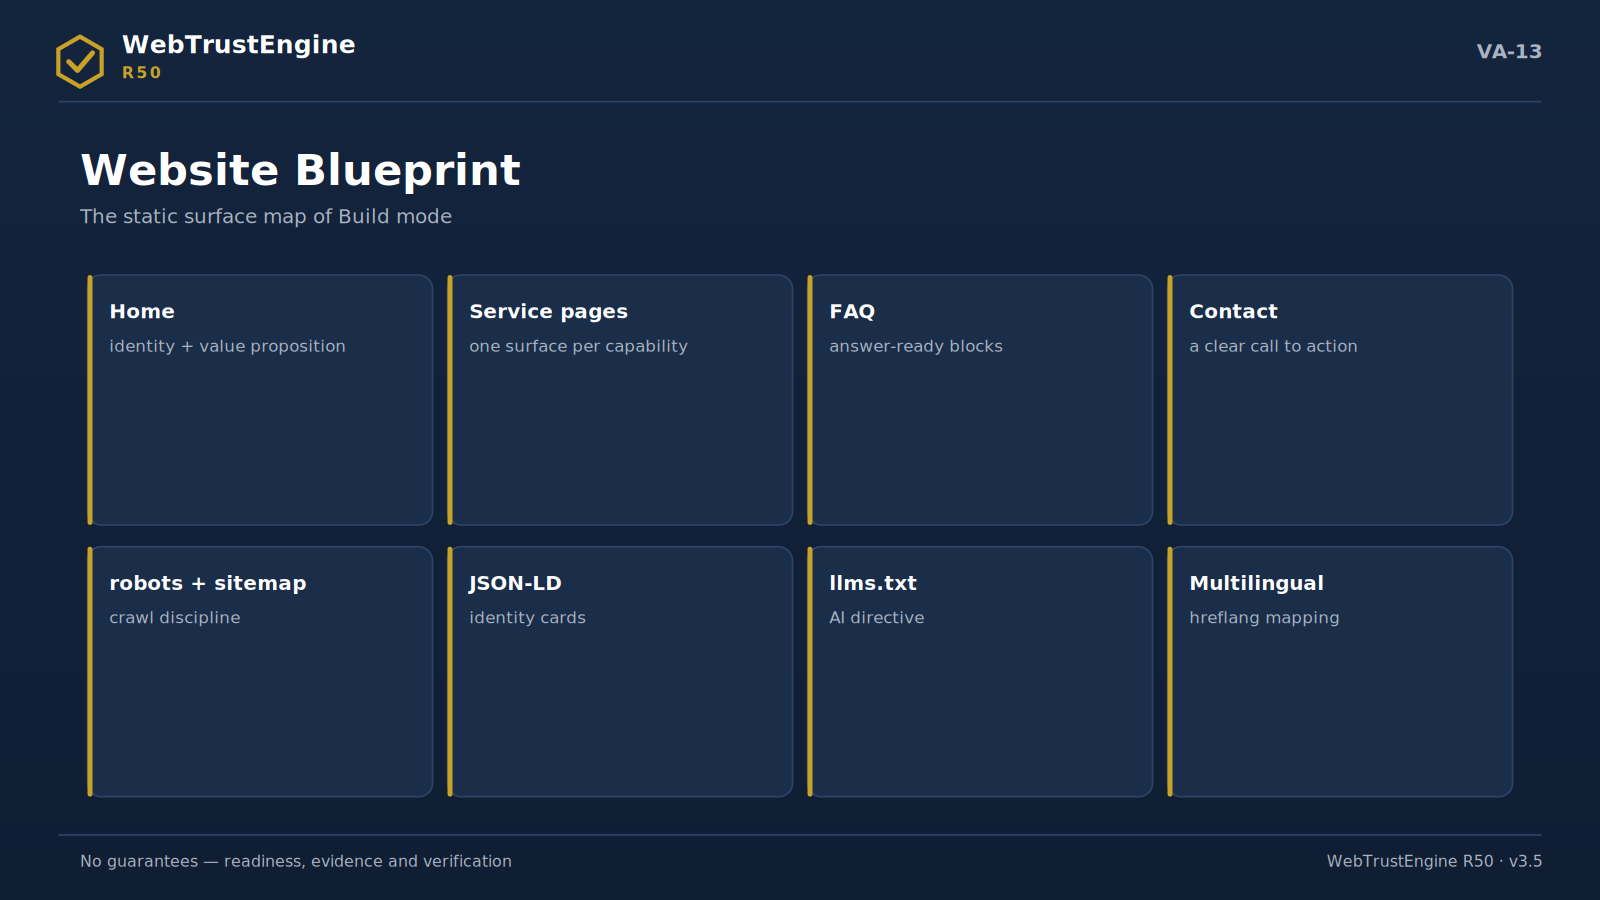
The website blueprint: eight building blocks of the static surface.

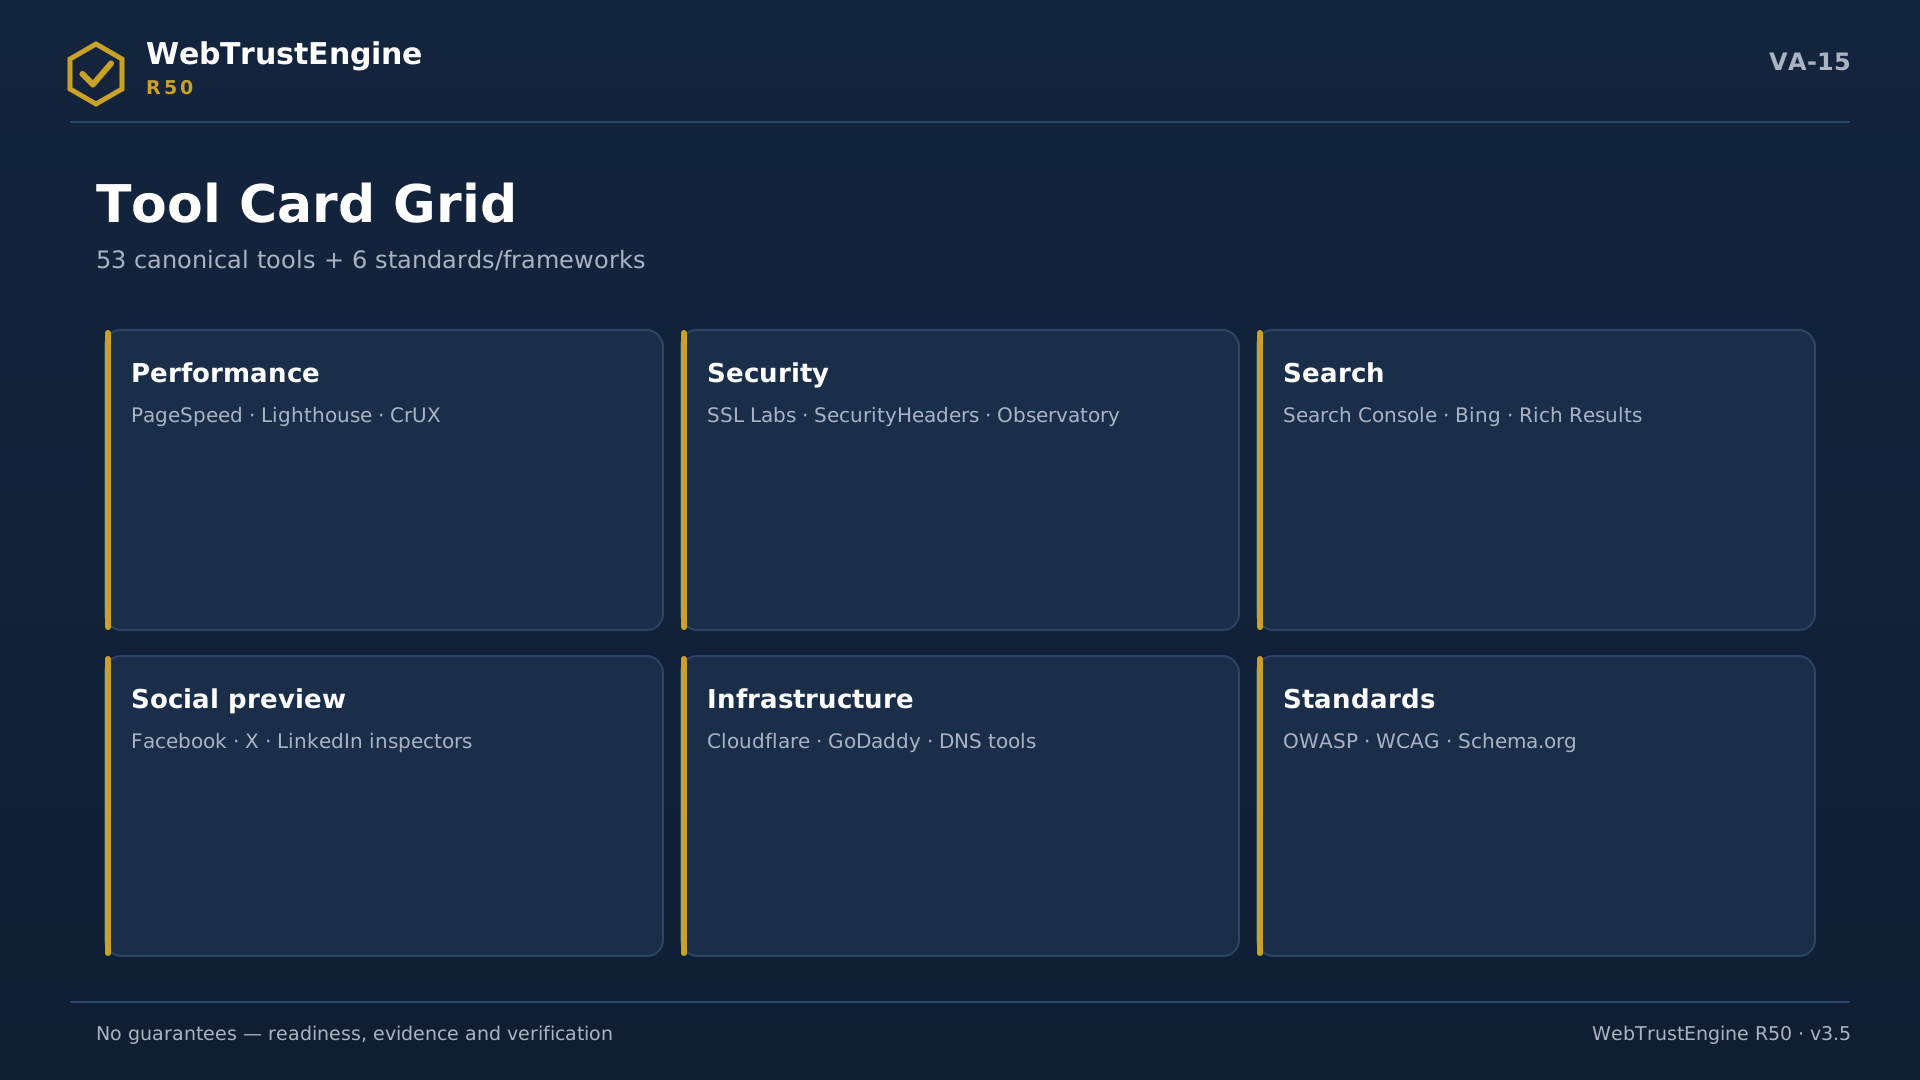
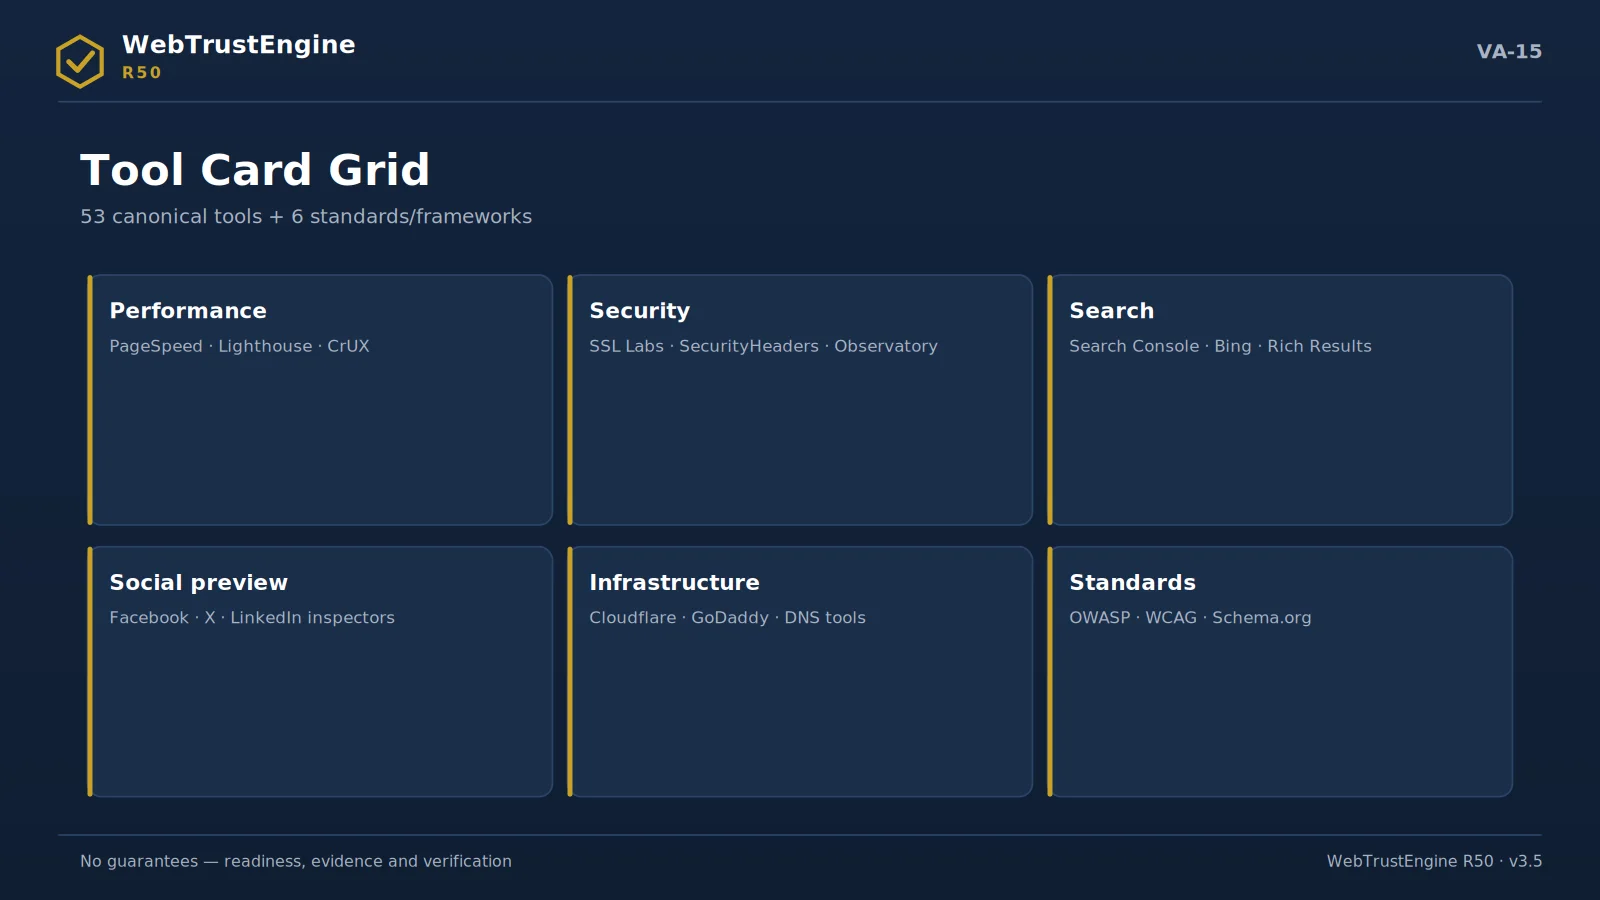
The tool card grid: 53 tools and 6 standards across six categories.


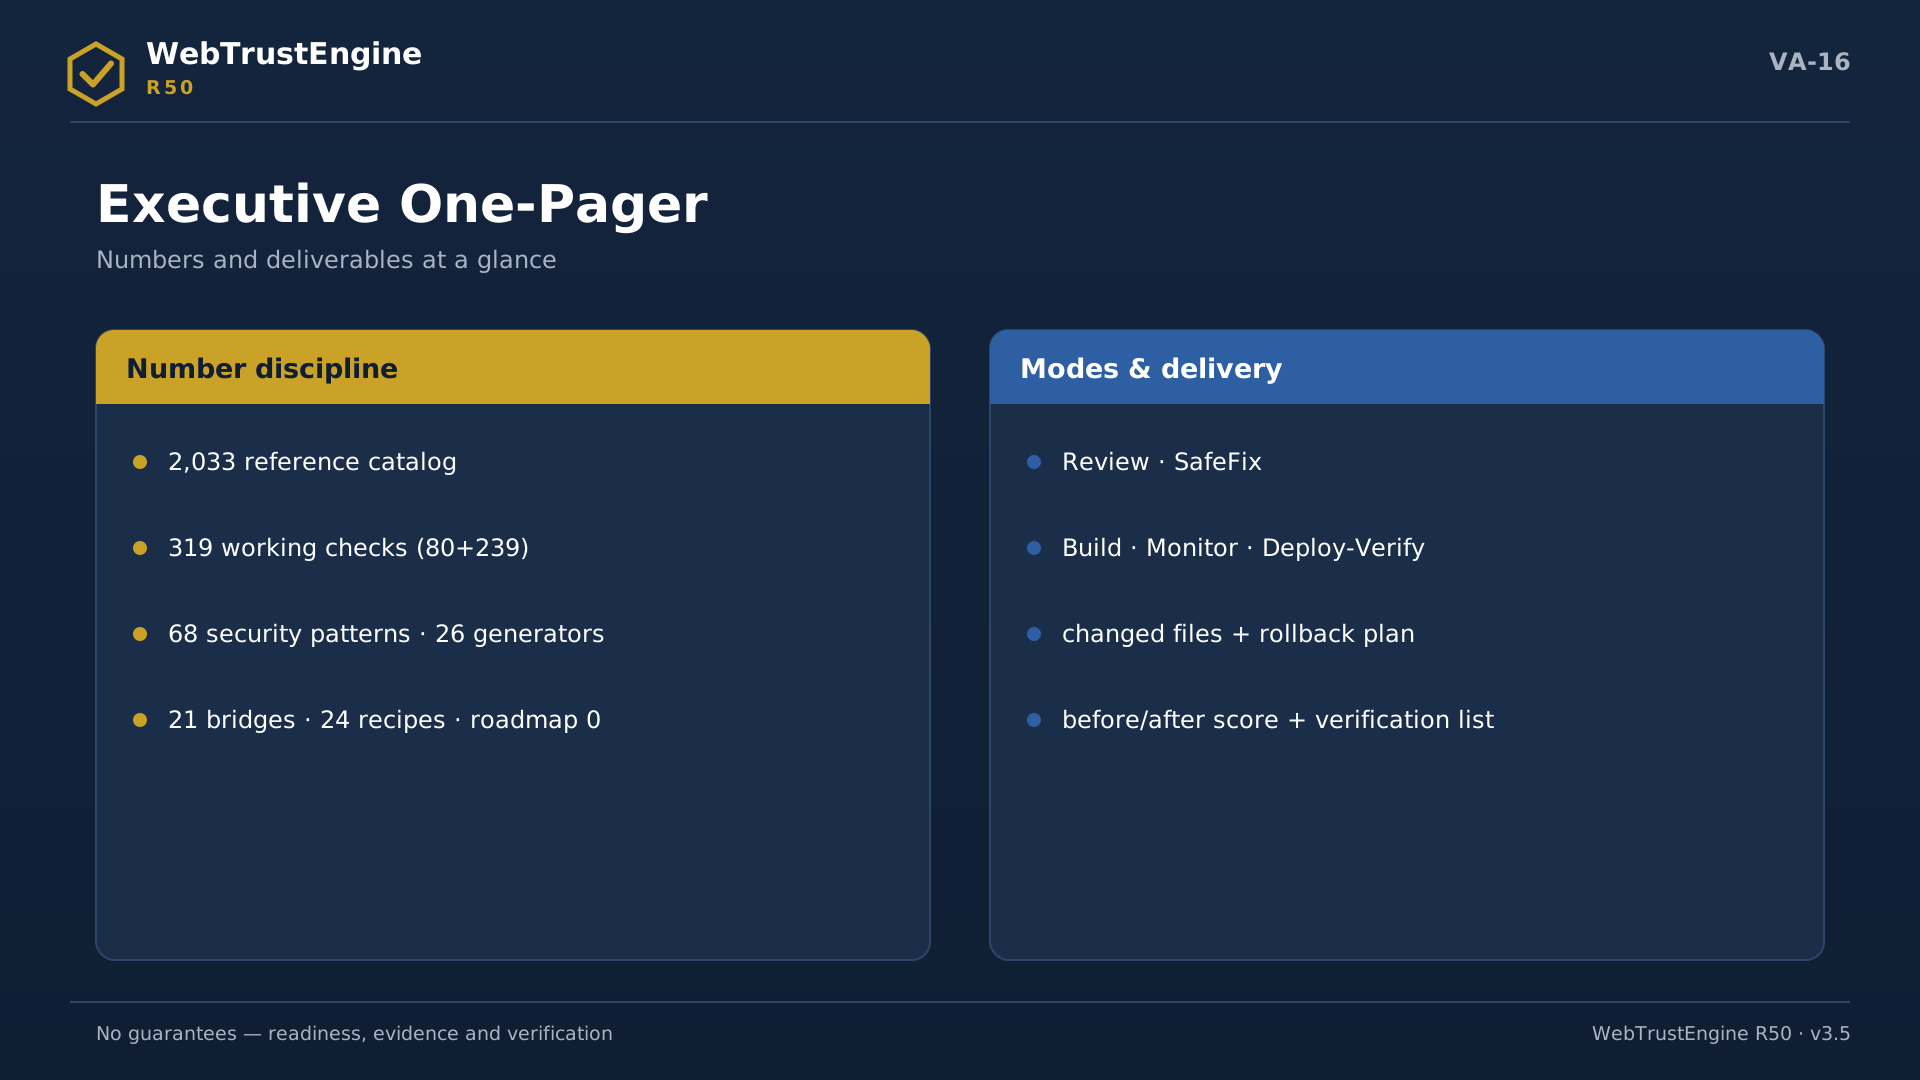
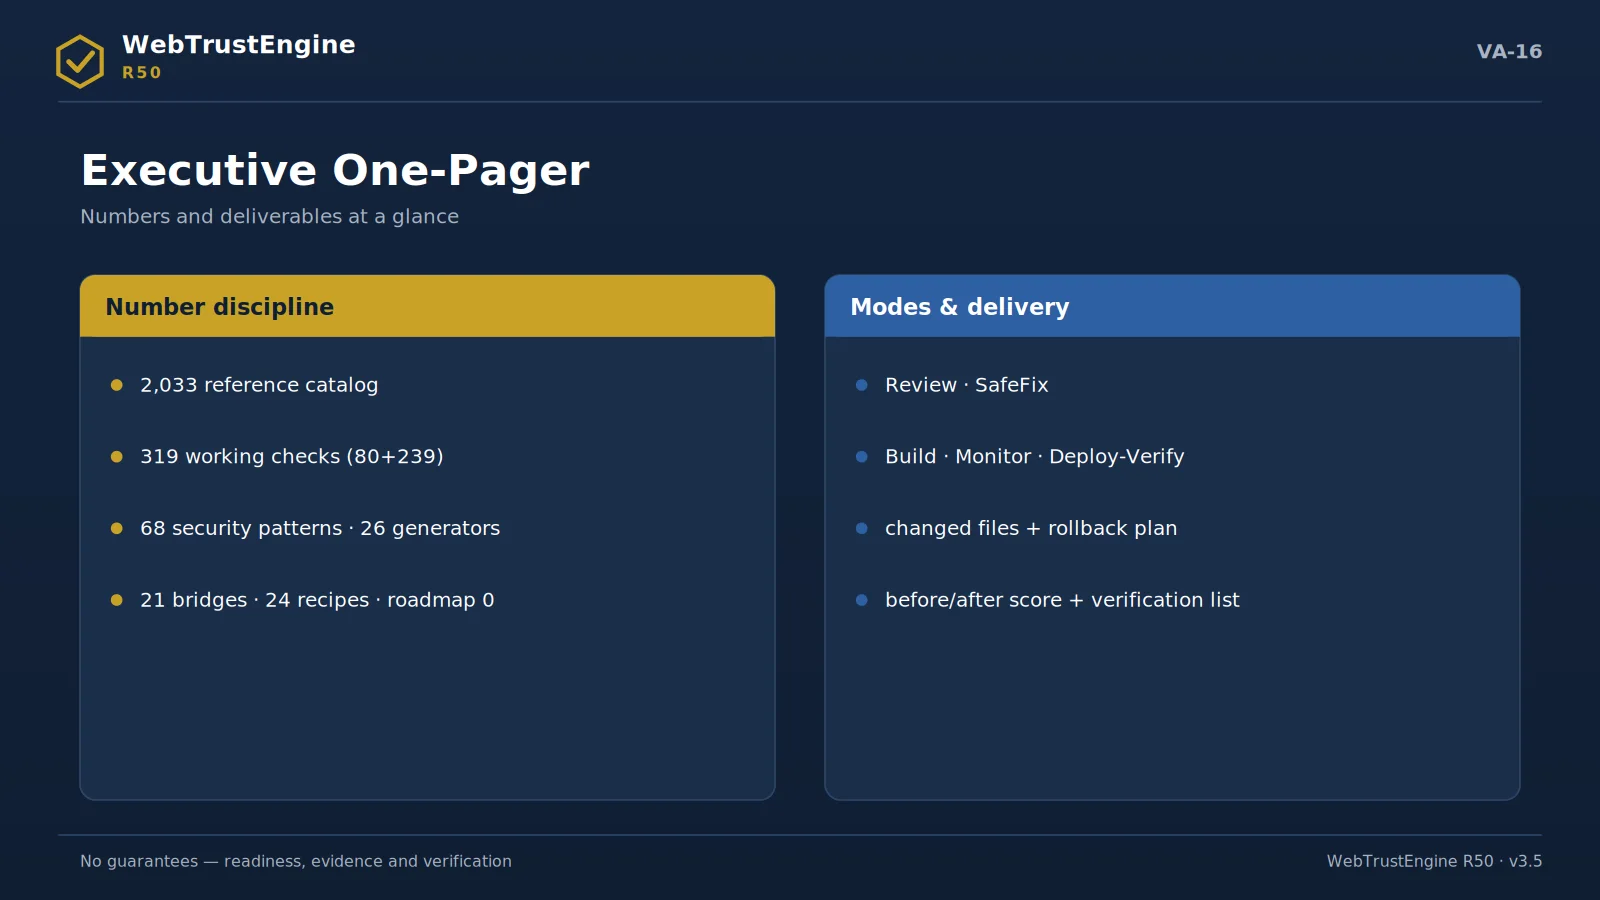
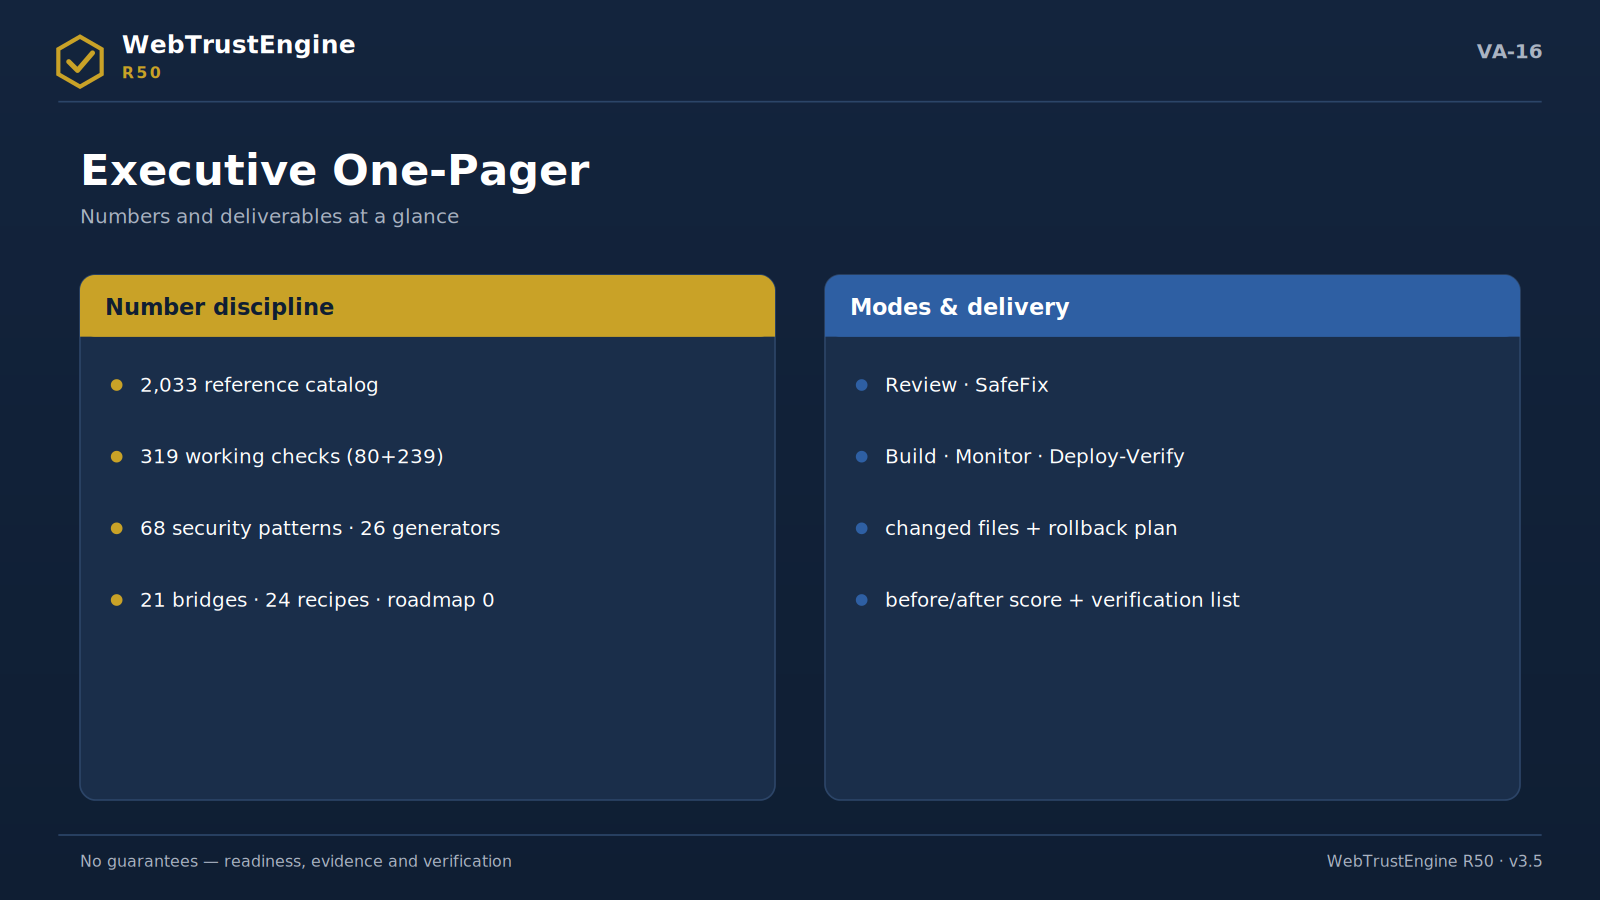
The one-pager: number discipline on the left, modes and deliverables on the right.

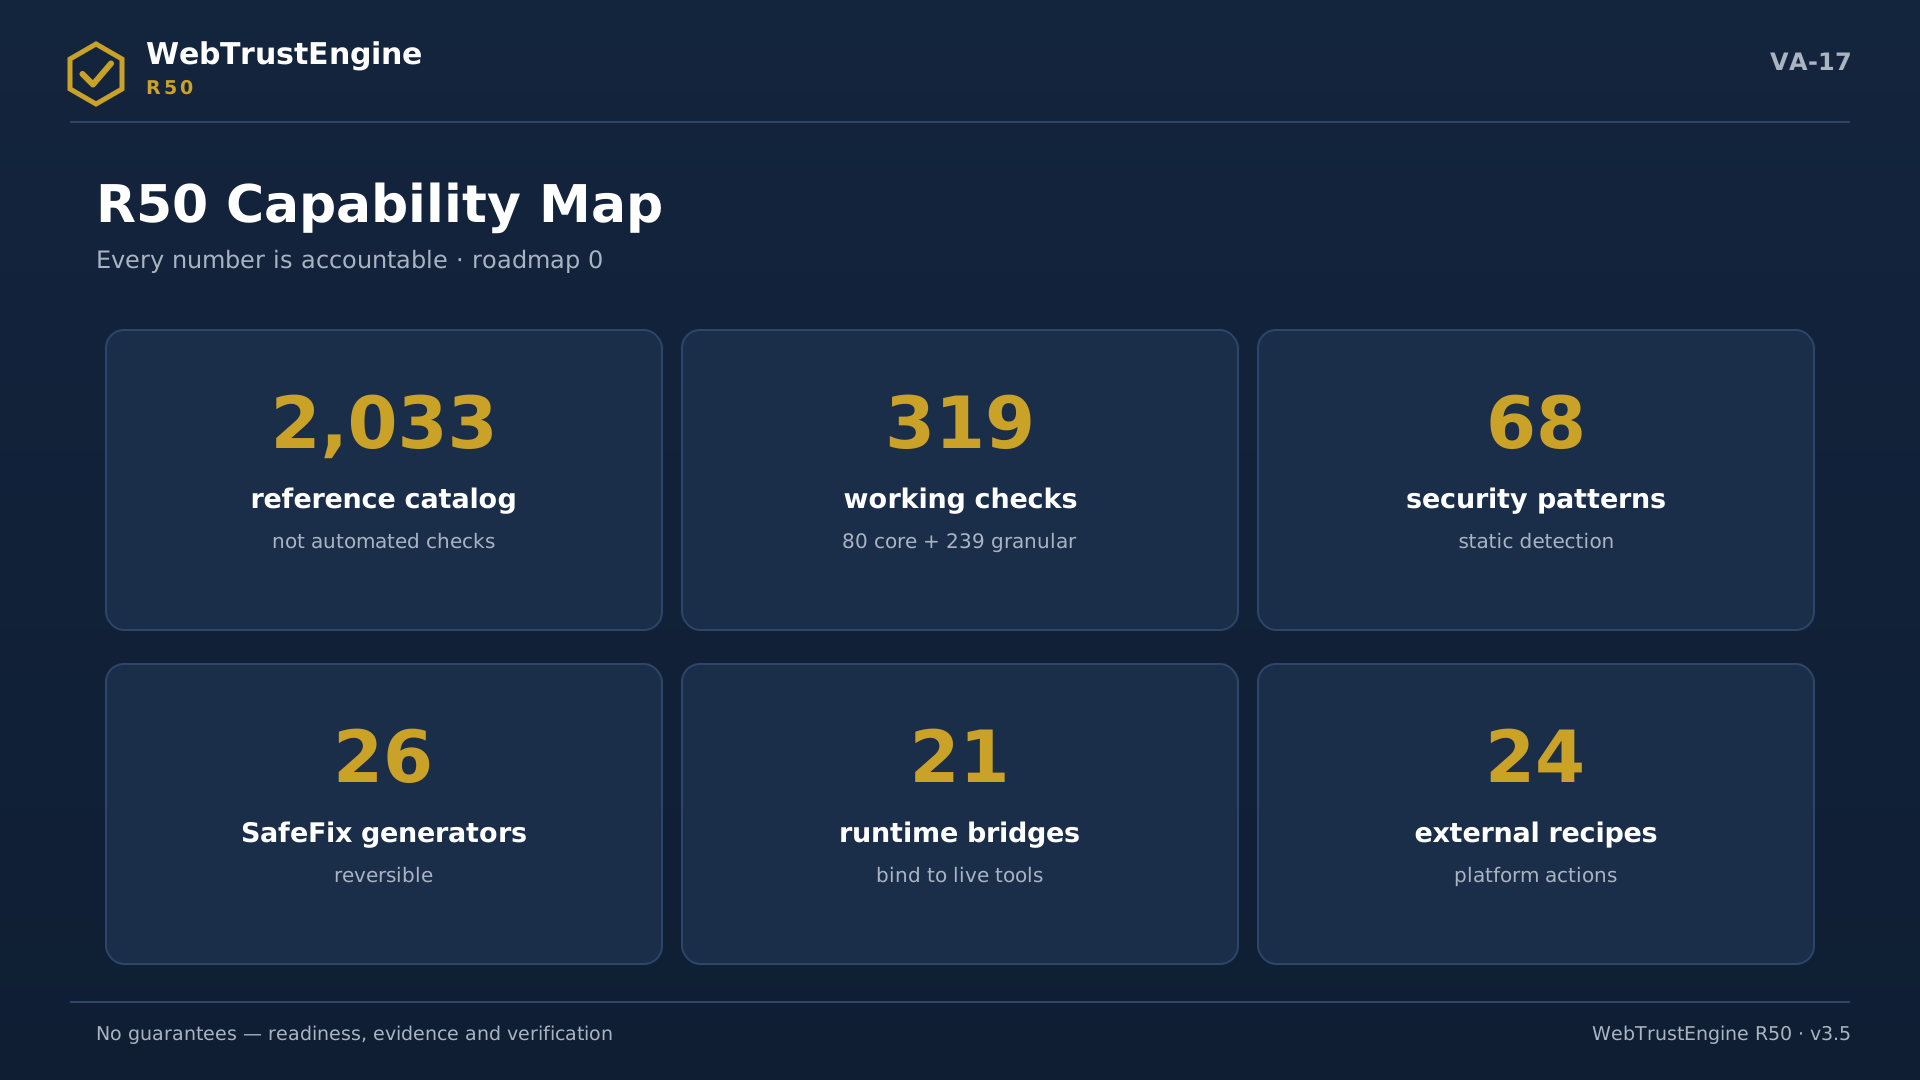
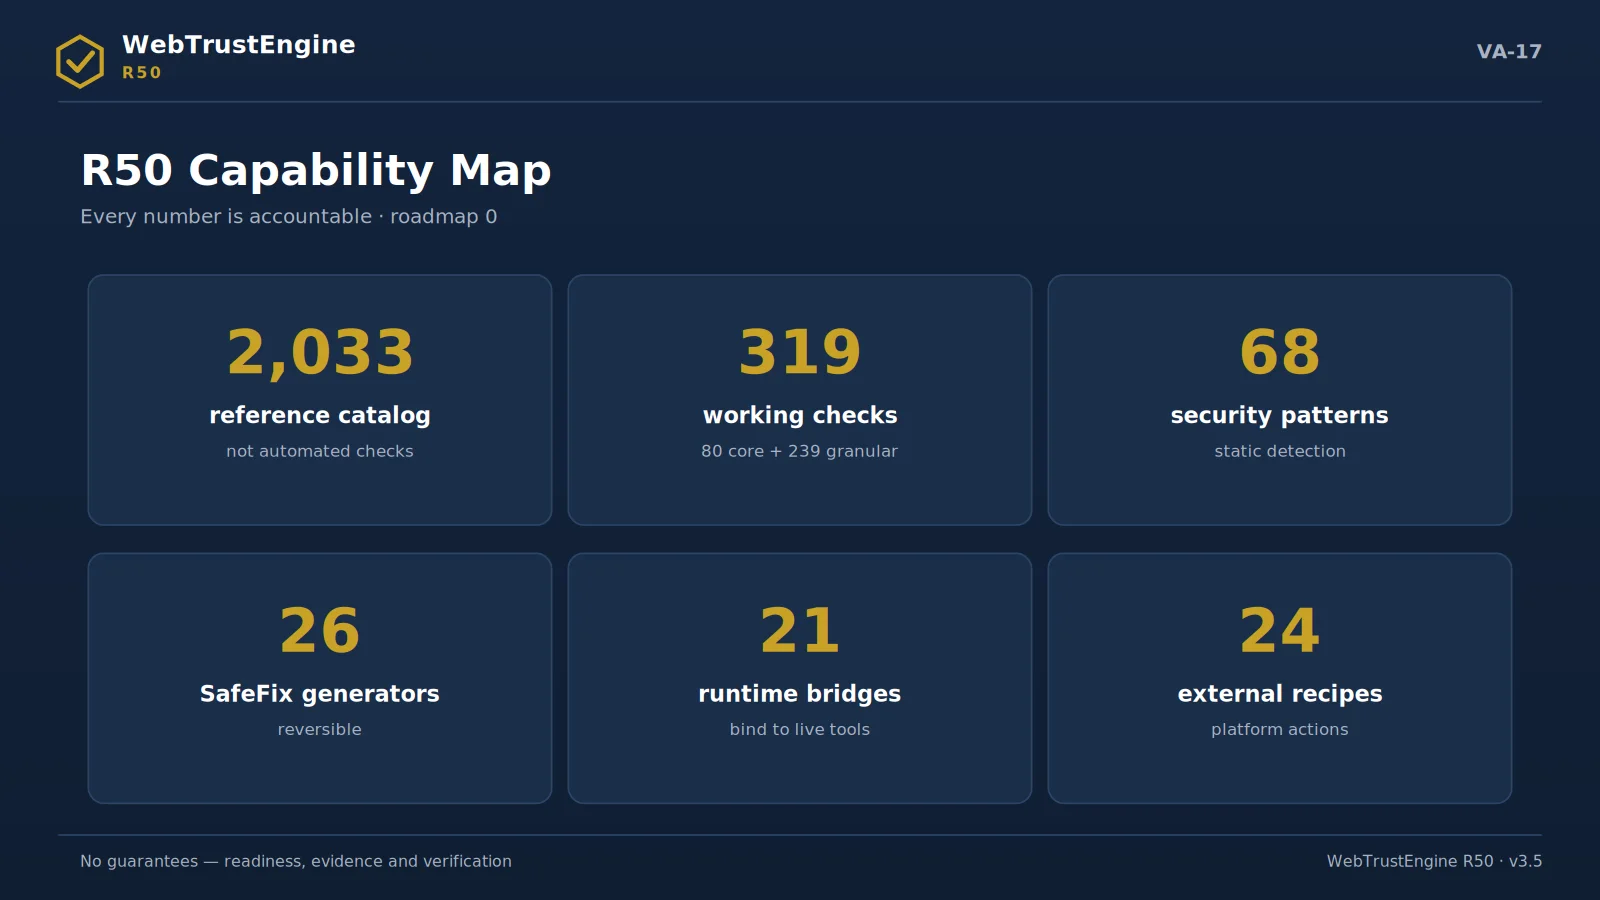
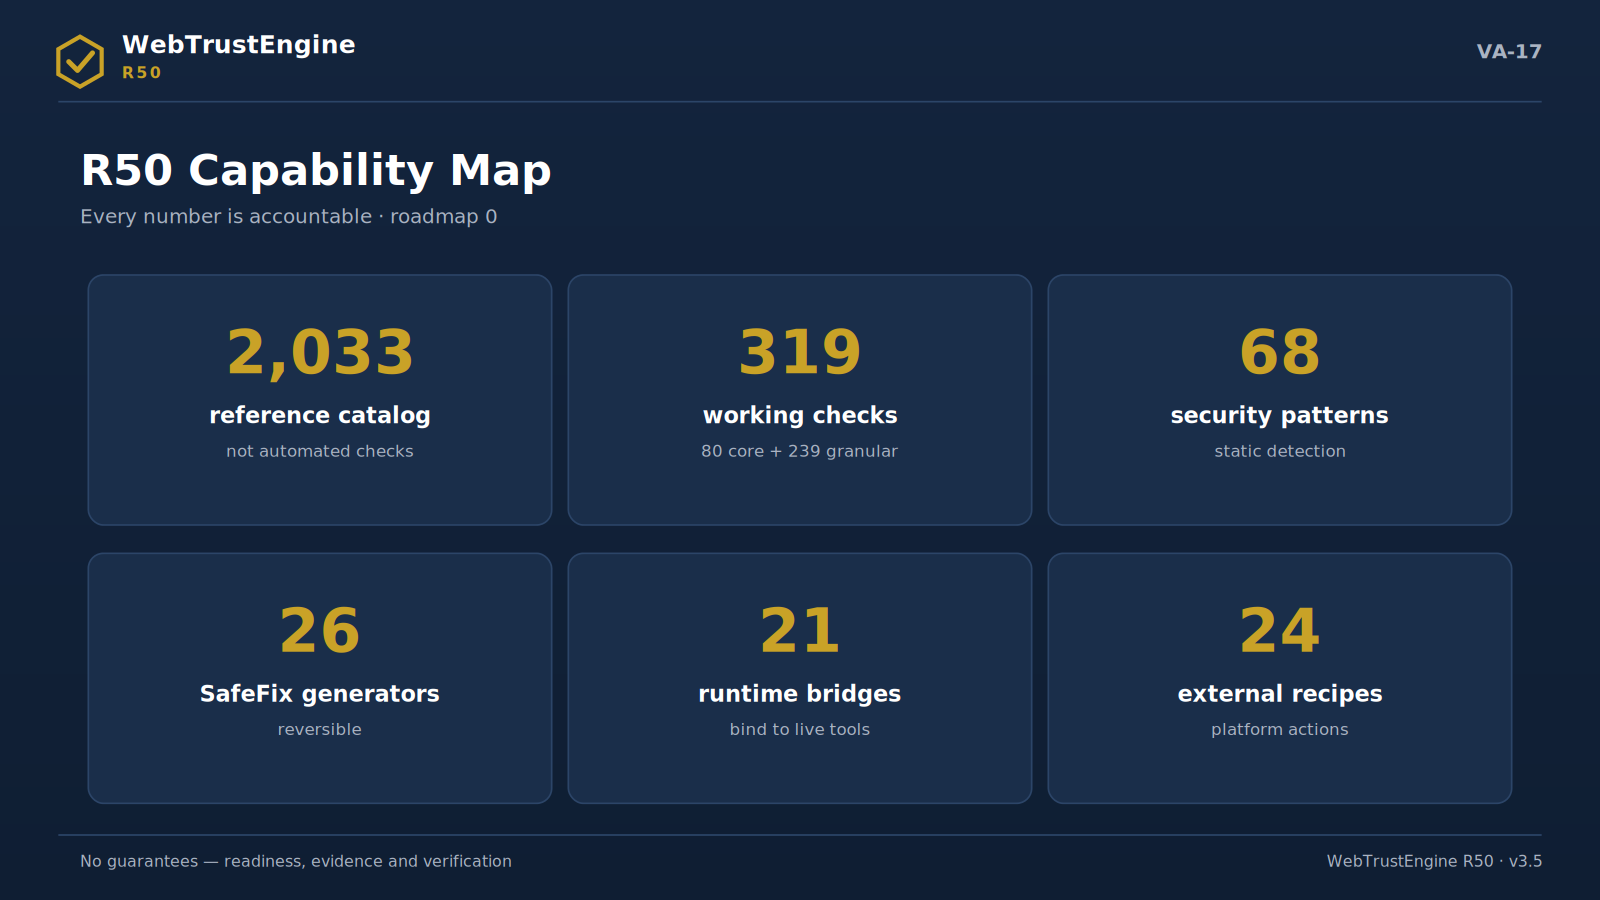
The R50 capability map: six core numbers and zero open roadmap items.

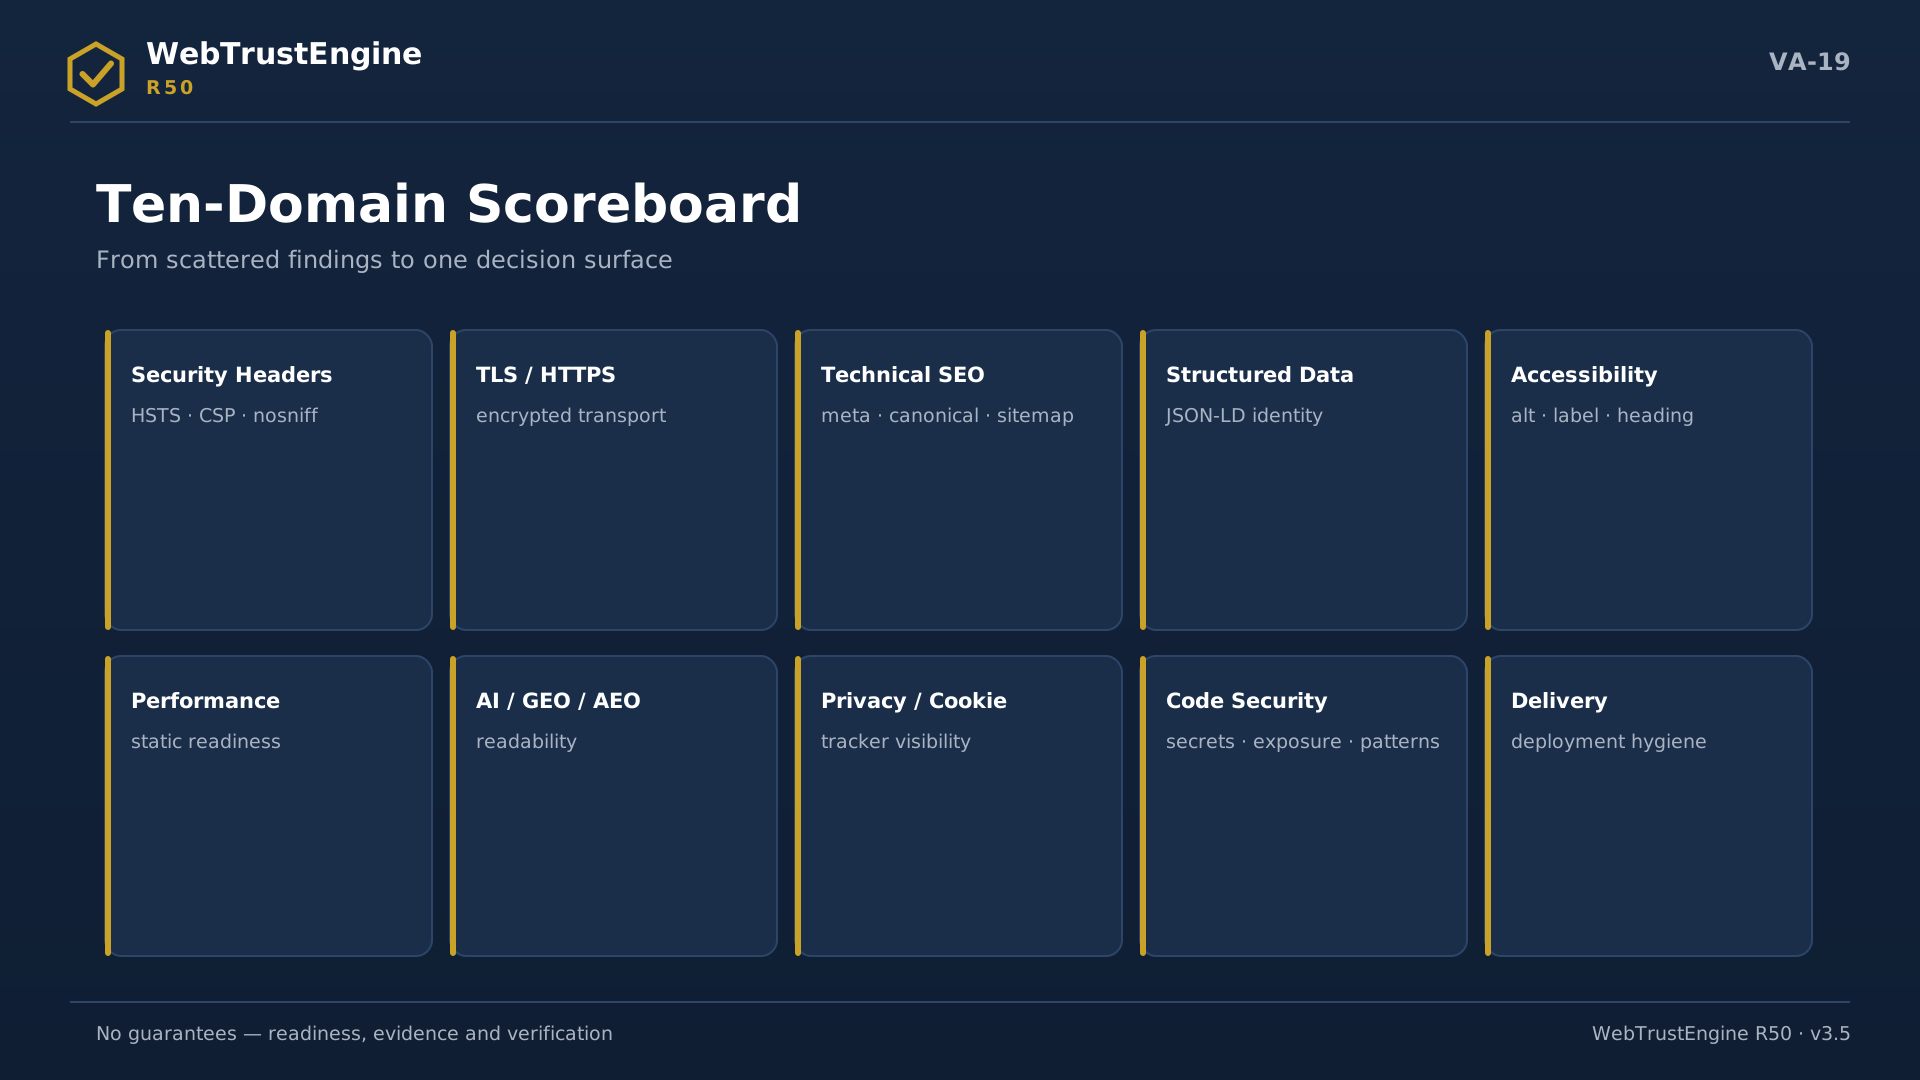
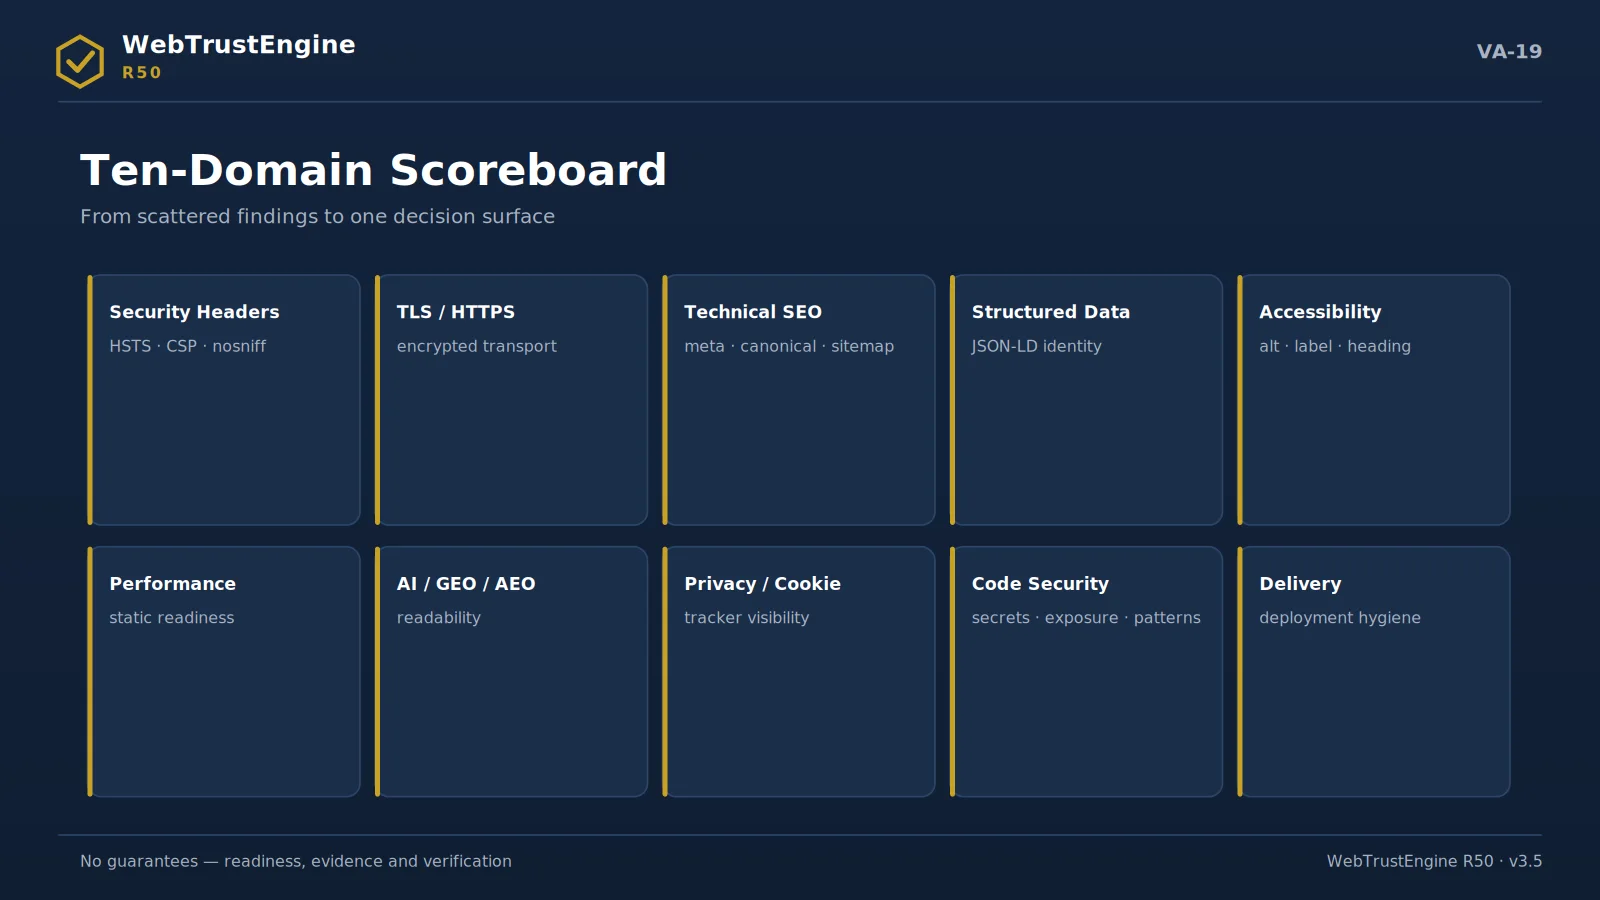
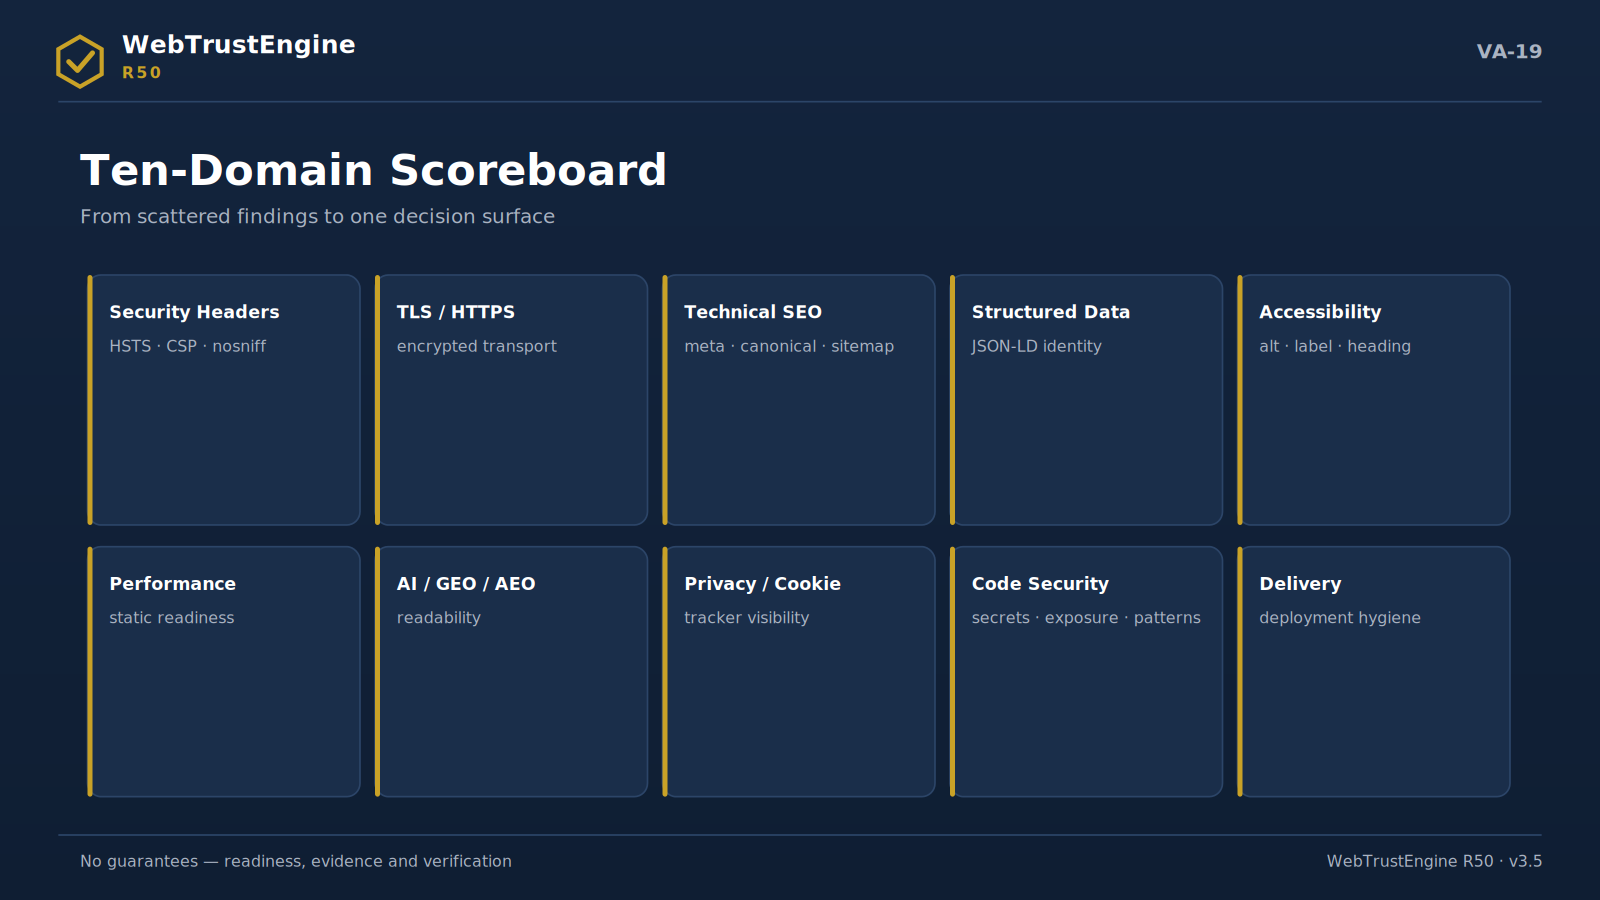
The ten-domain scoreboard: the full decision surface from security to delivery.

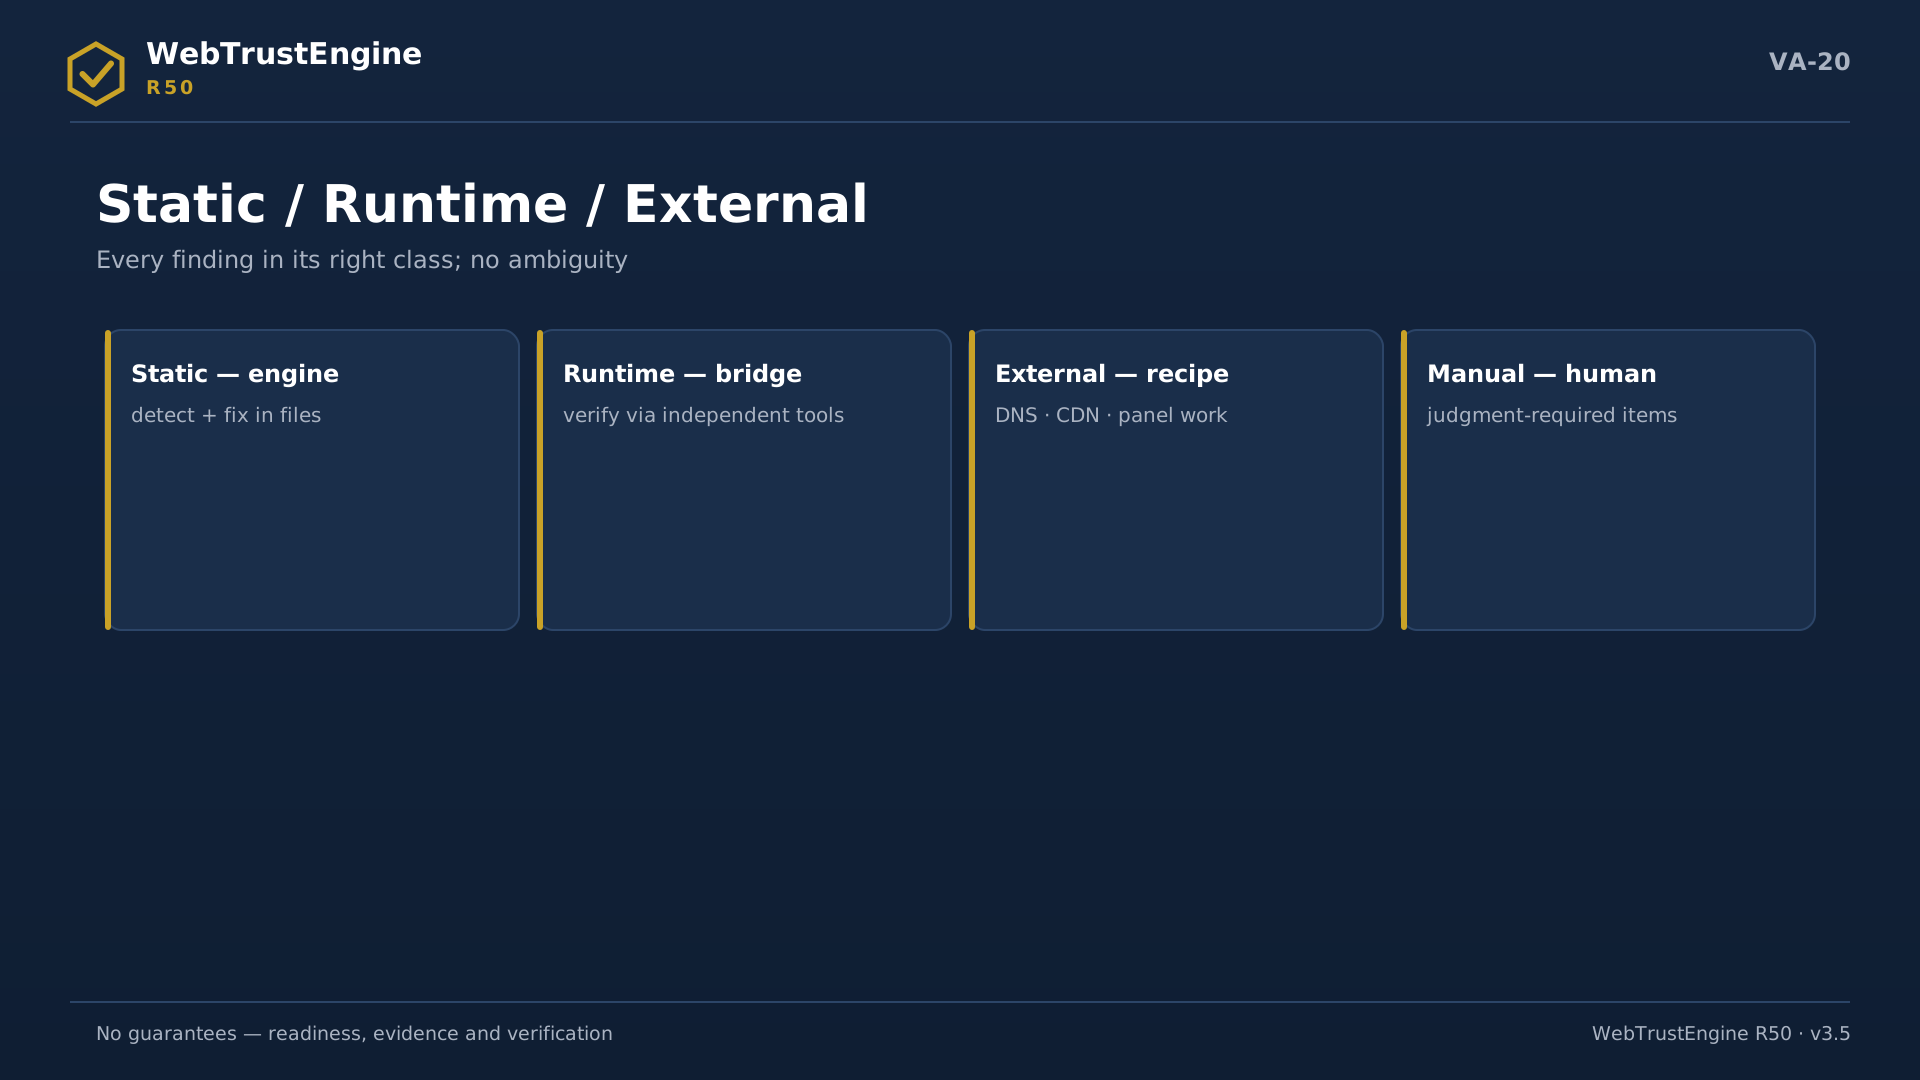
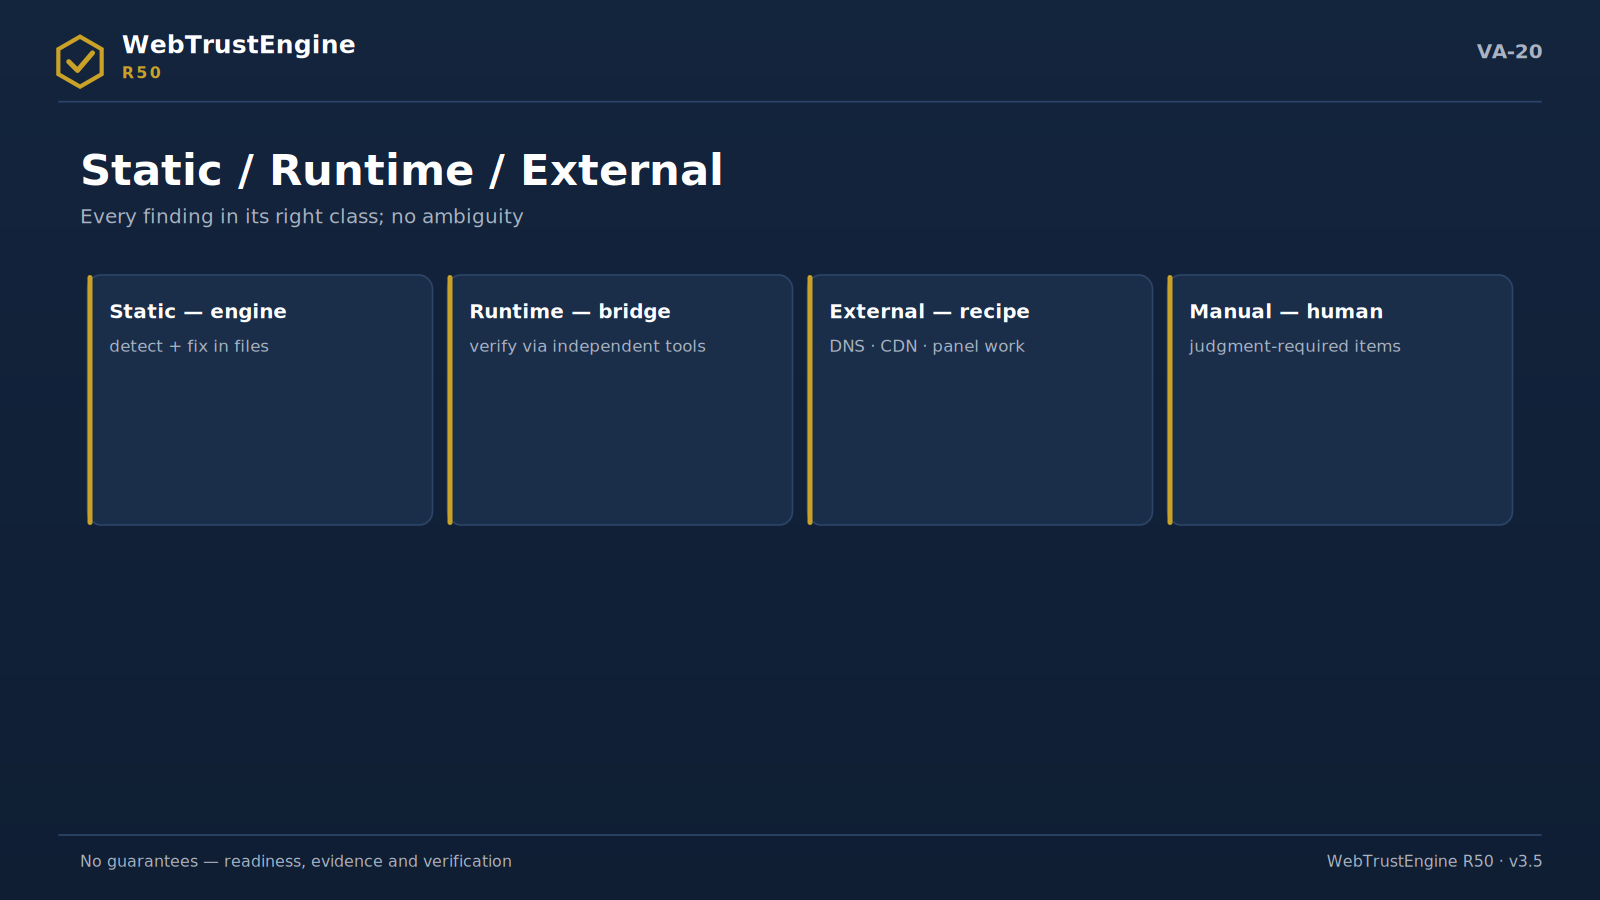
The four-class split: static, runtime, external and outside-automated-scope.

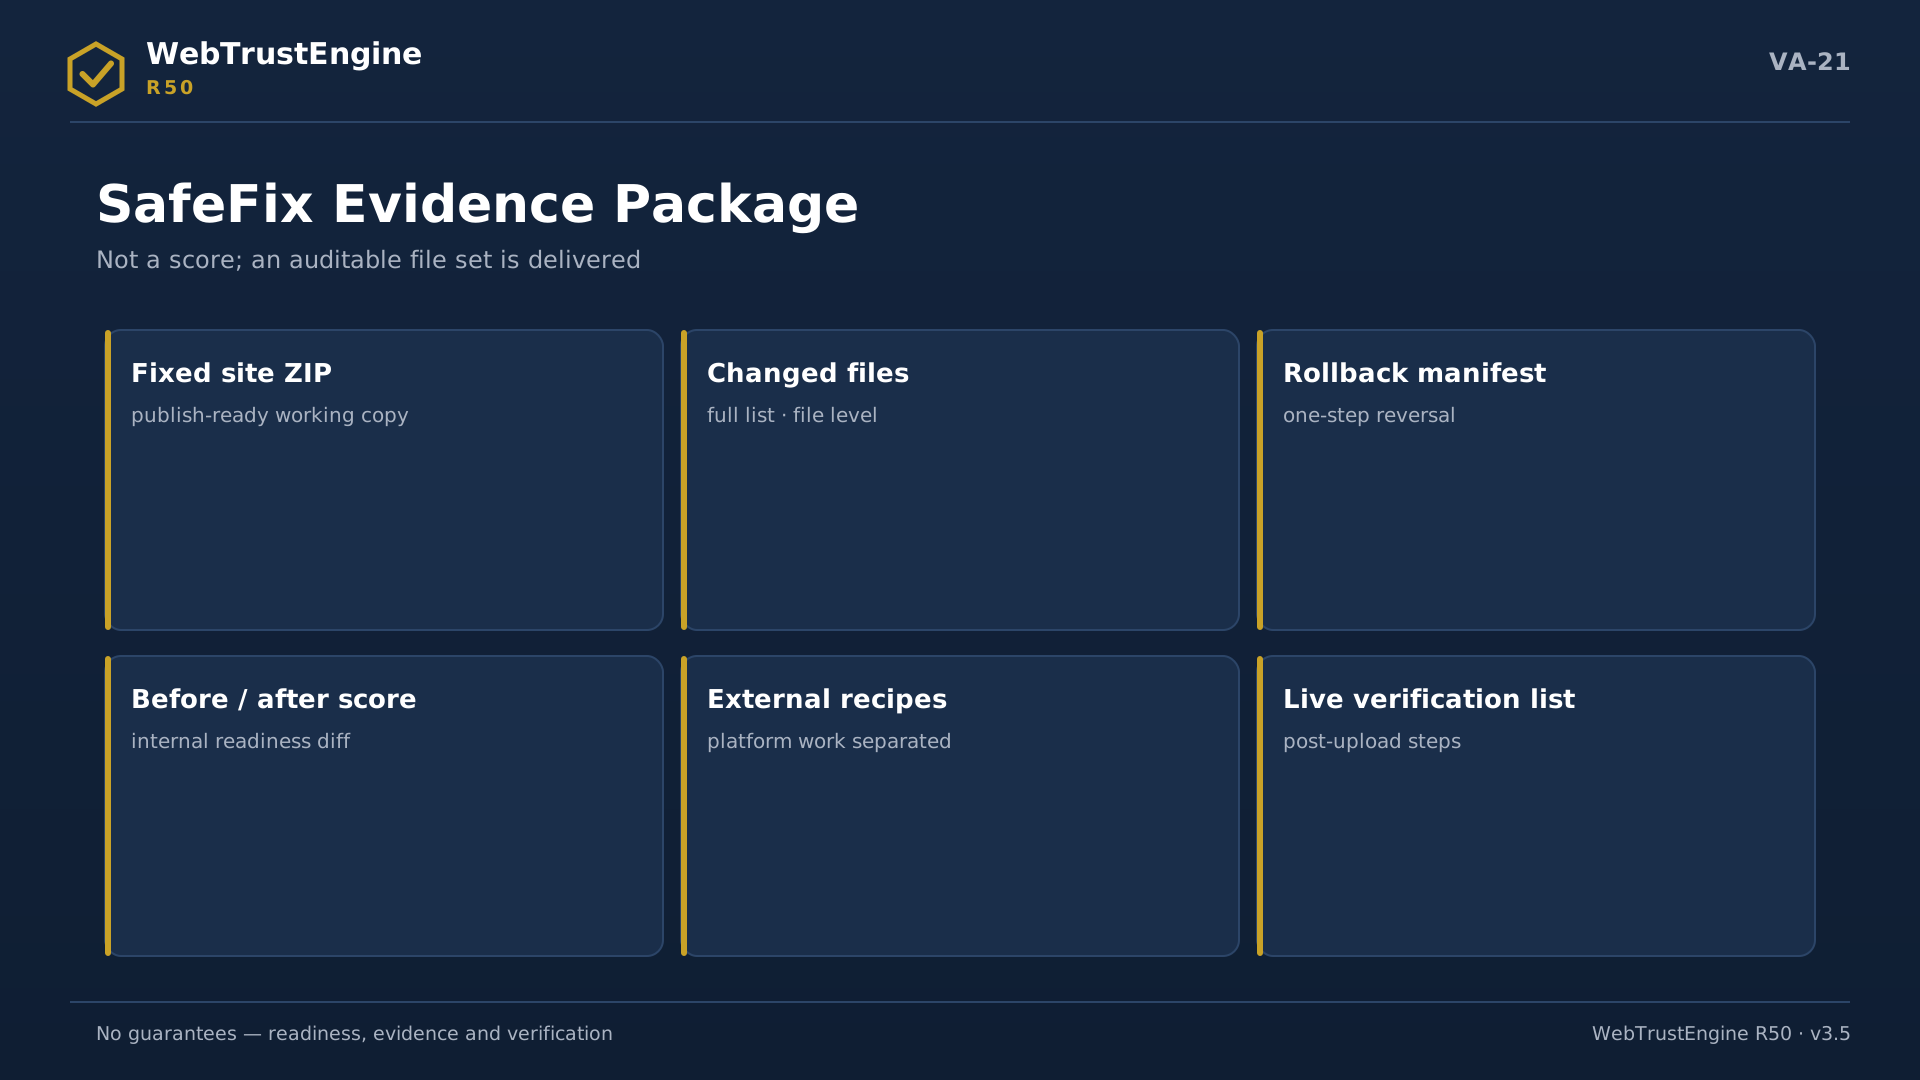
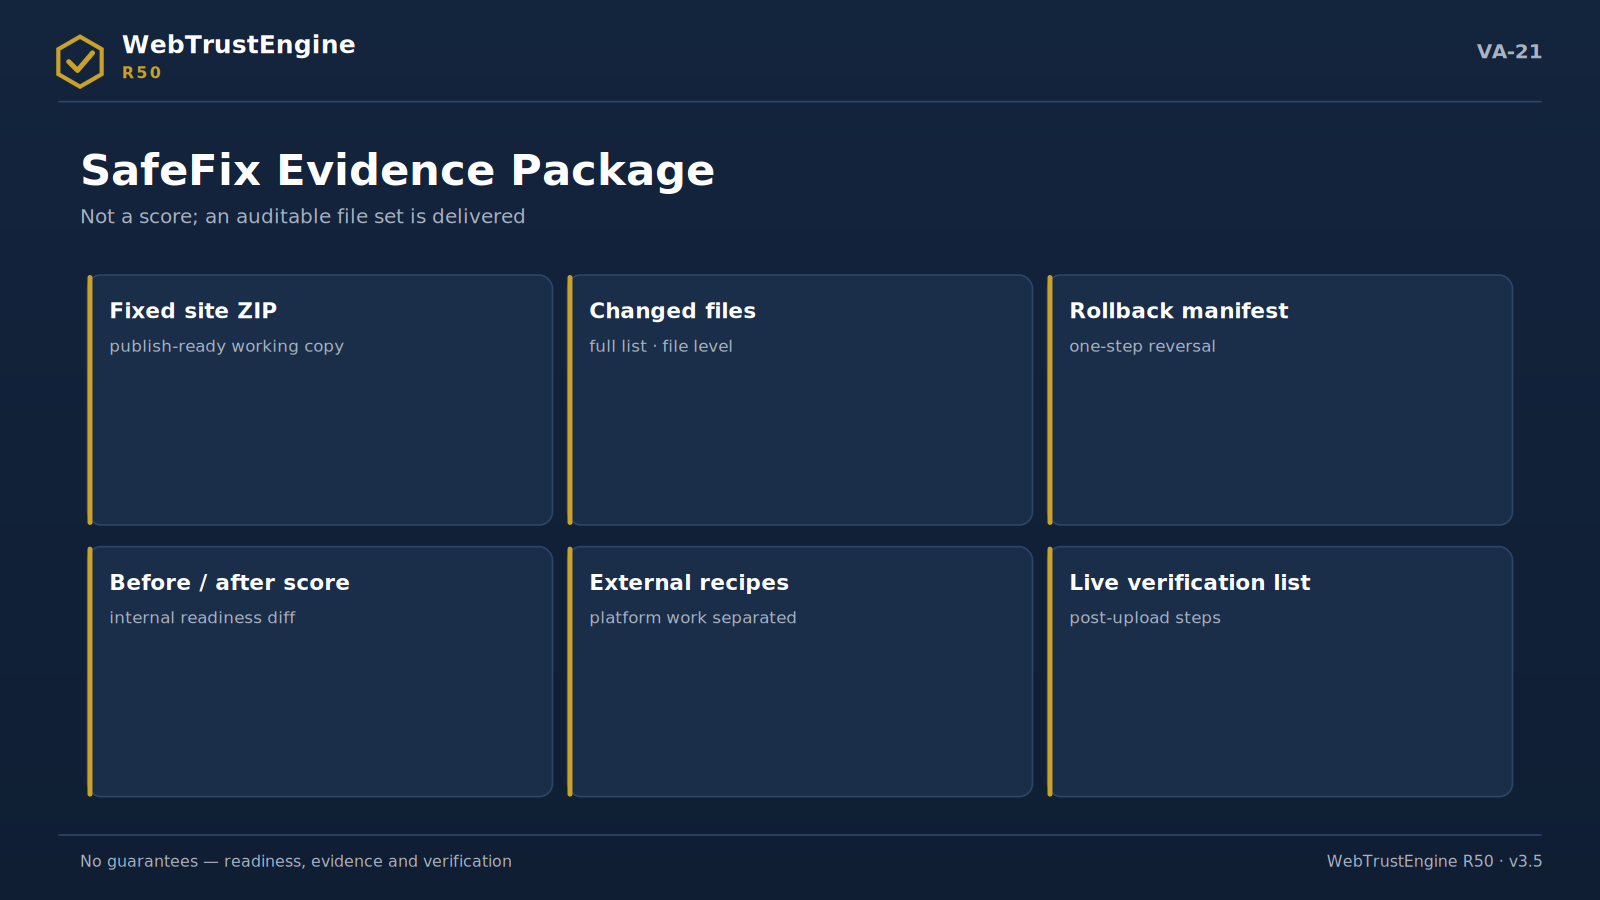
The SafeFix evidence package: six delivery items.
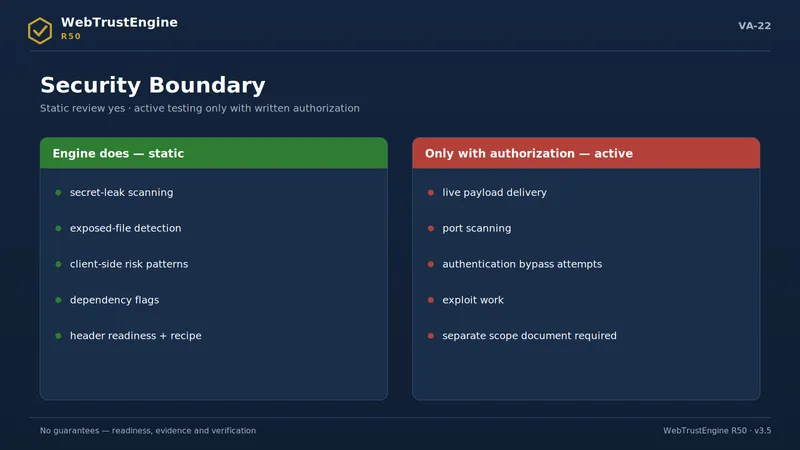
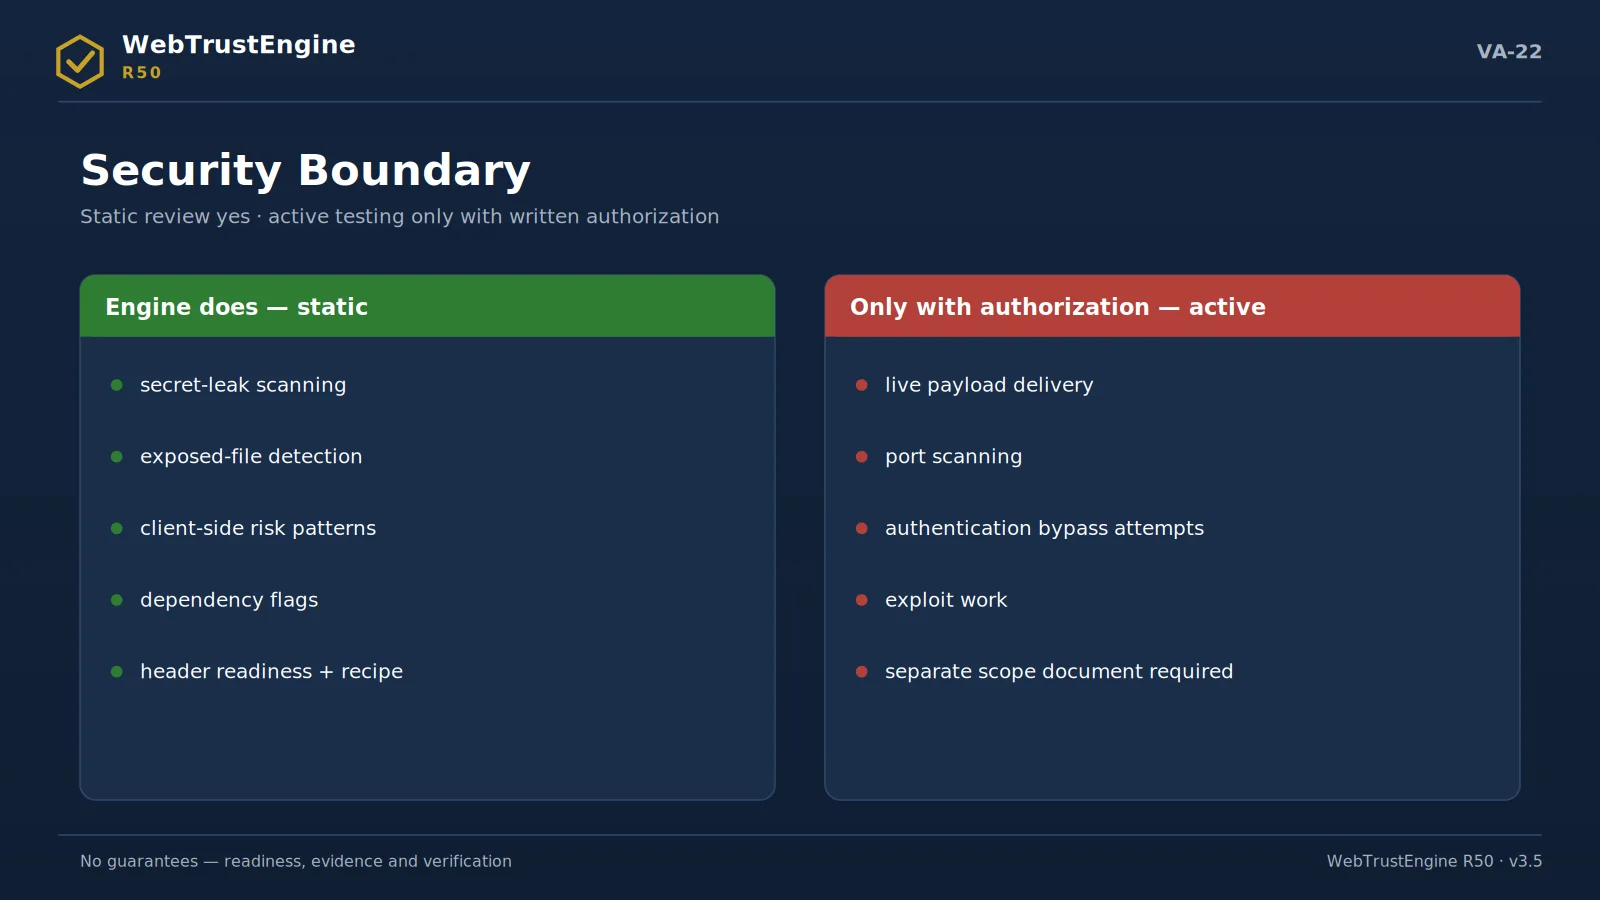
The security boundary: static review is engine work; active testing needs separate authorization and scope.
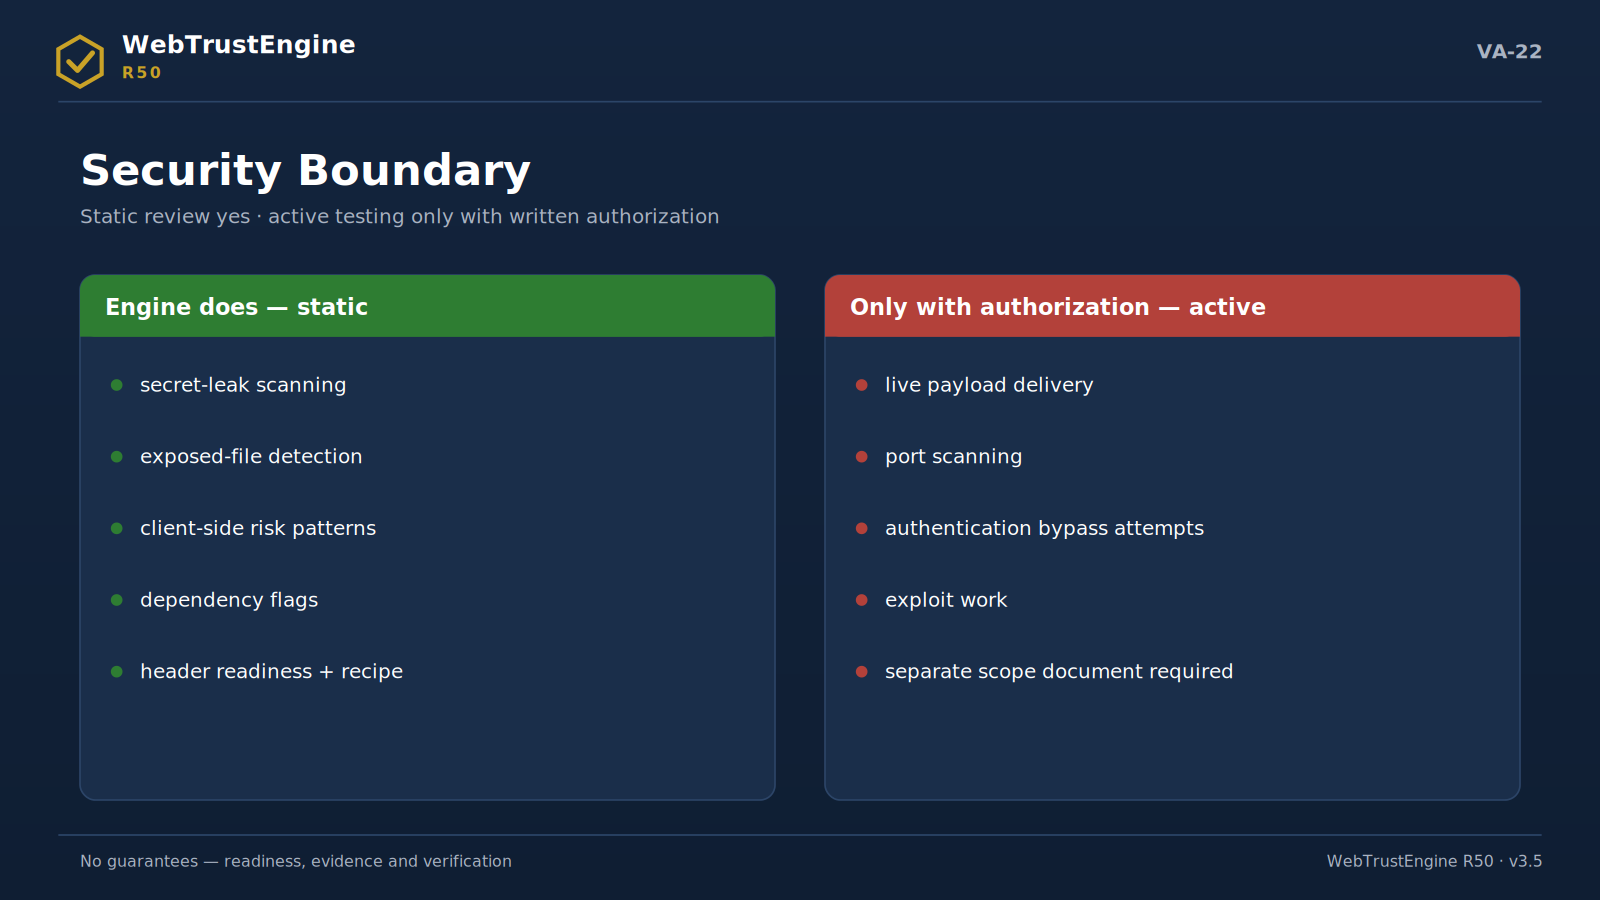
The security boundary: static review is engine work; active testing needs separate authorization and scope.
Process and evidence flows
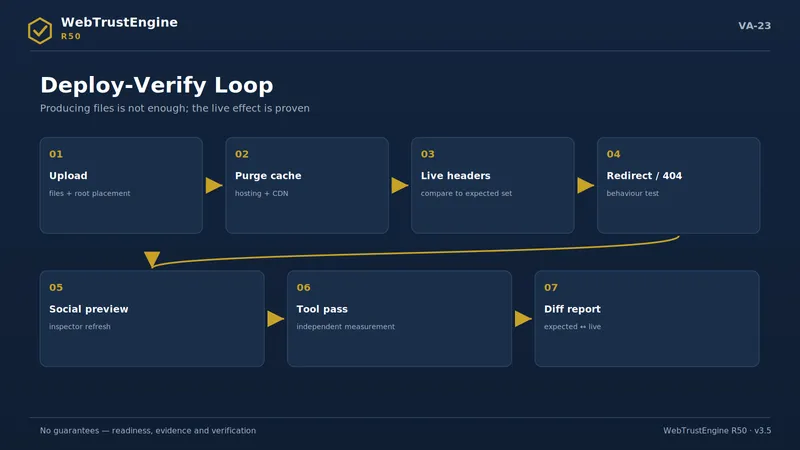
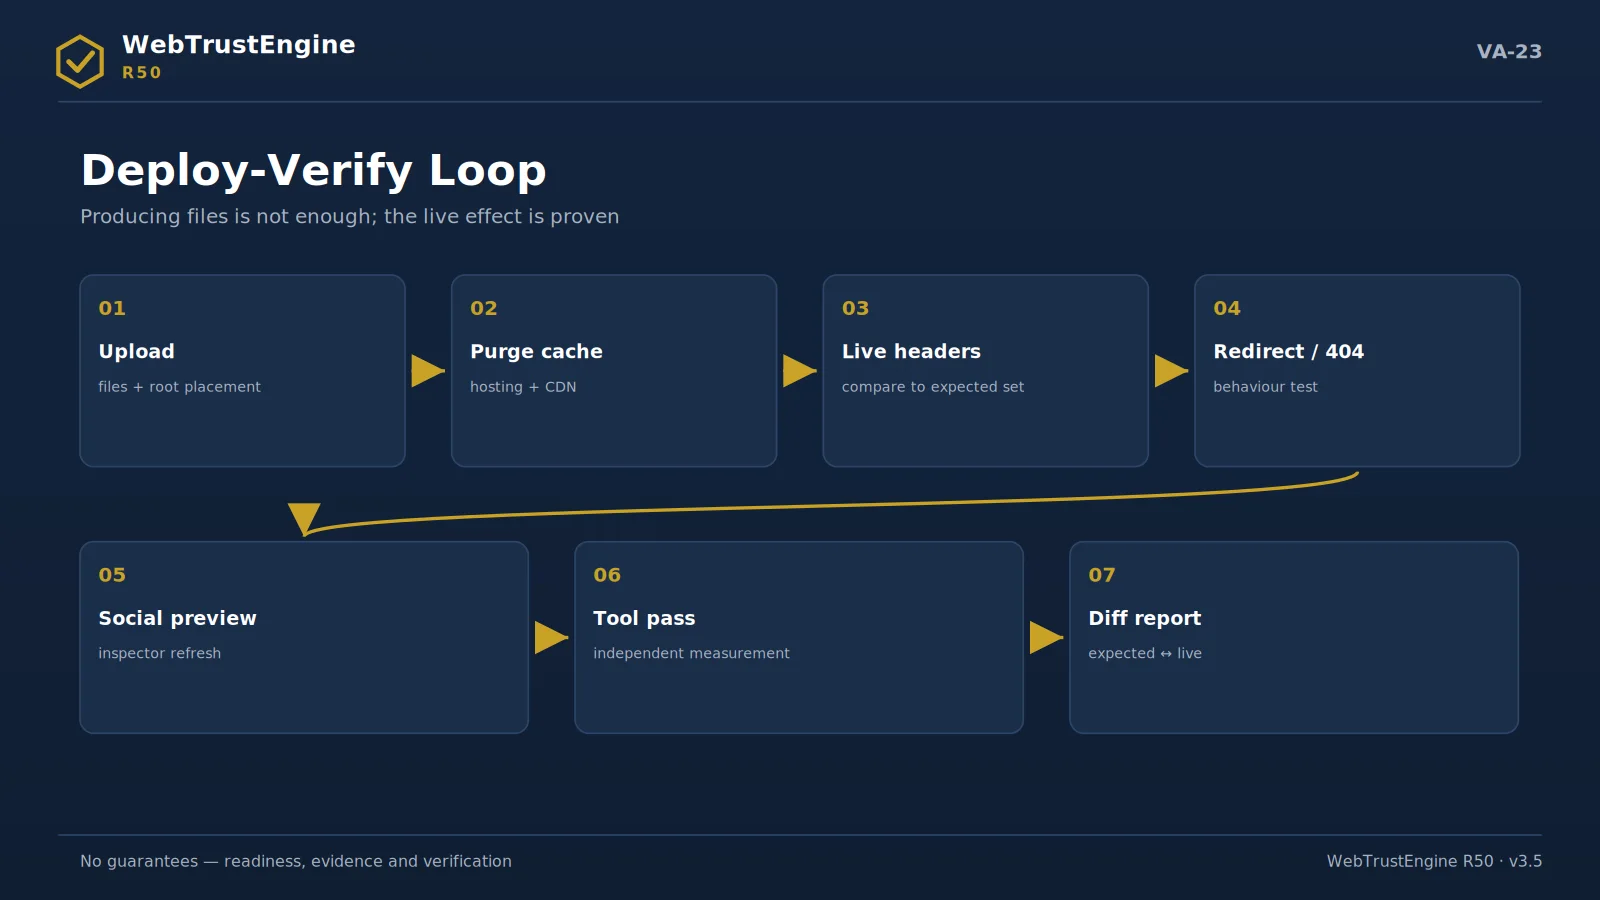
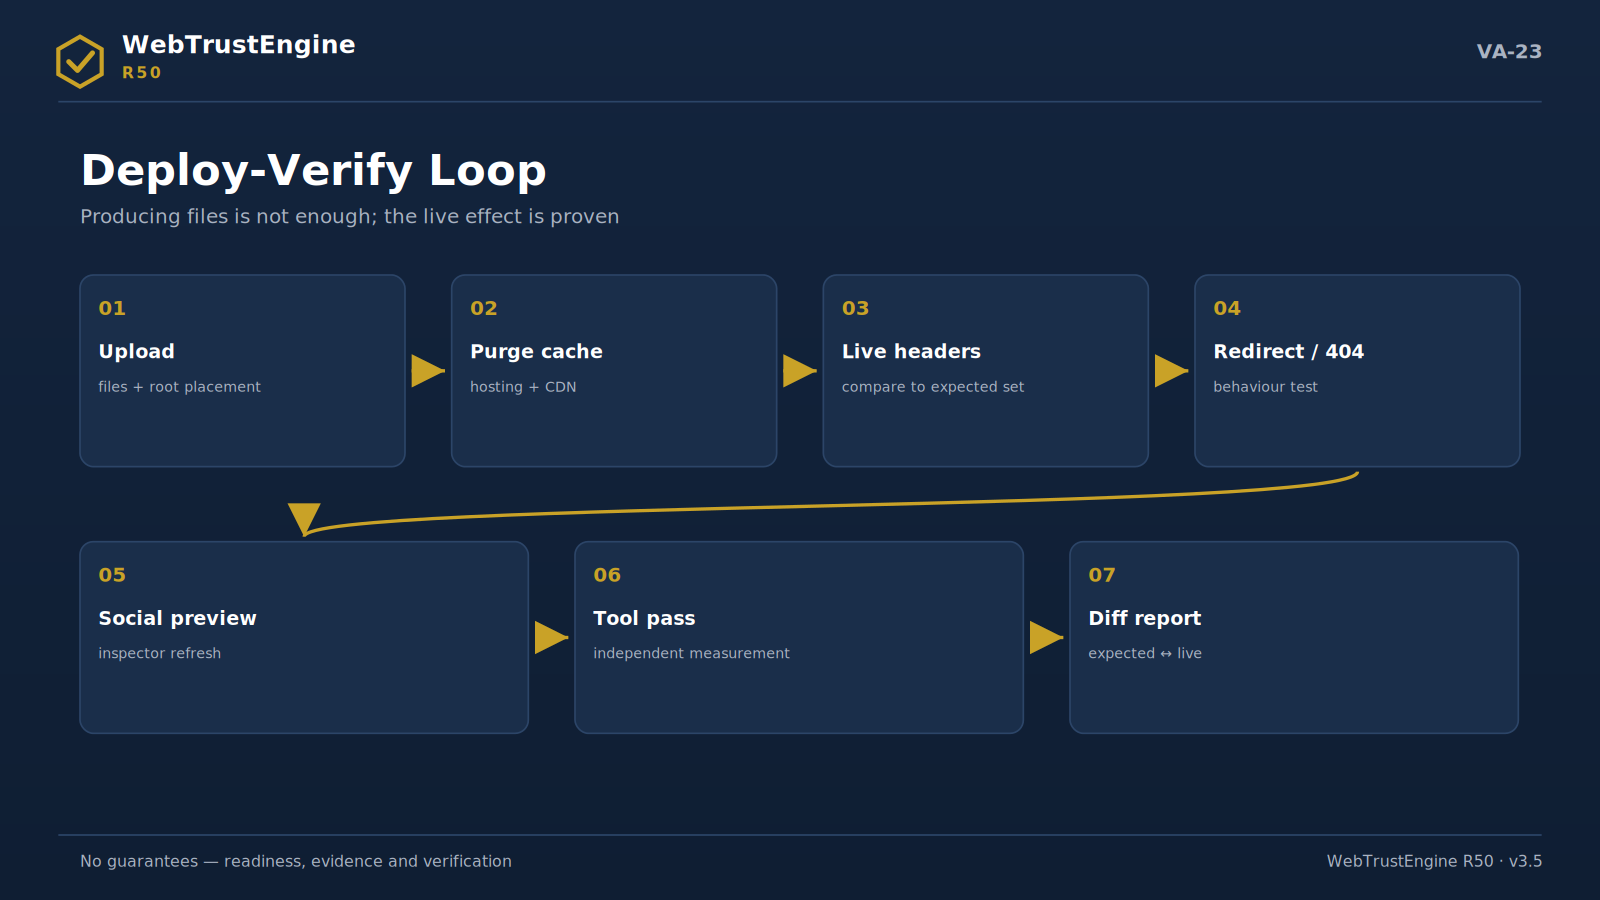
The Deploy-Verify loop: seven steps from upload to the diff report.

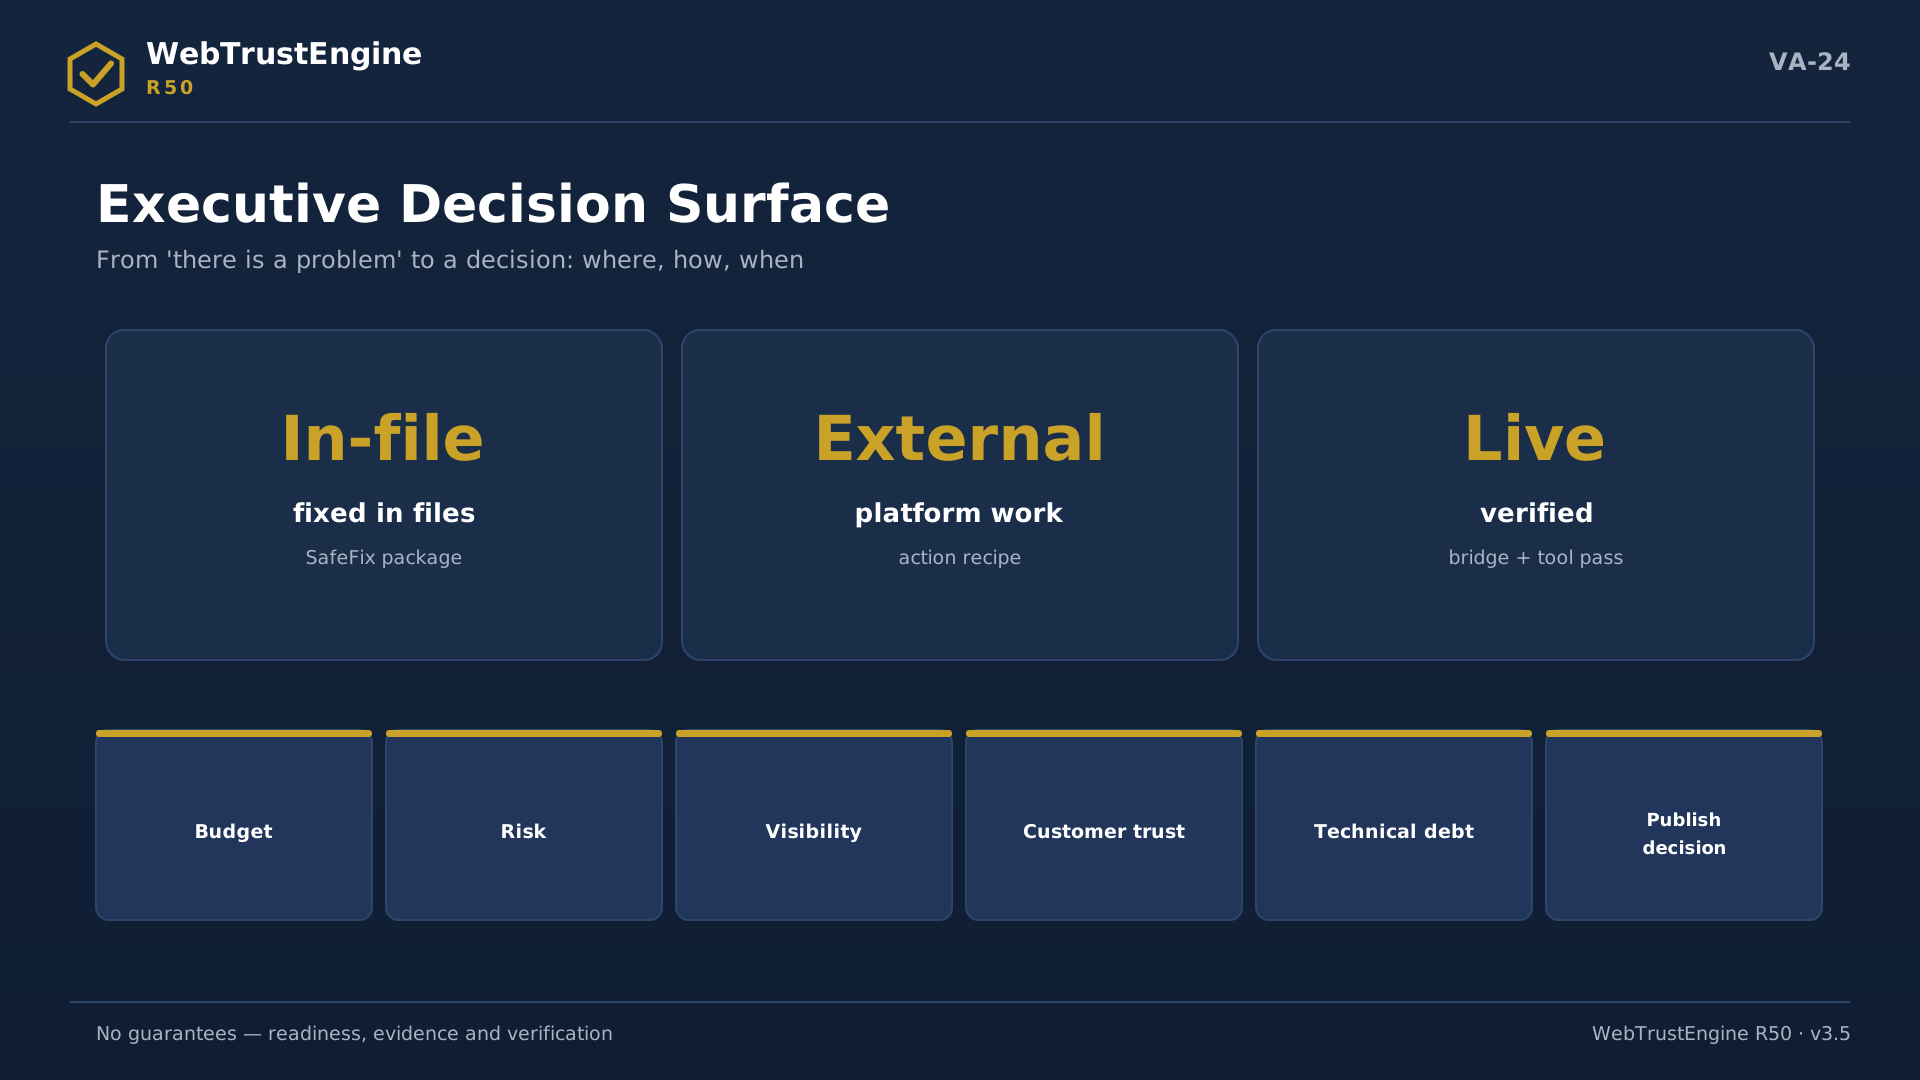
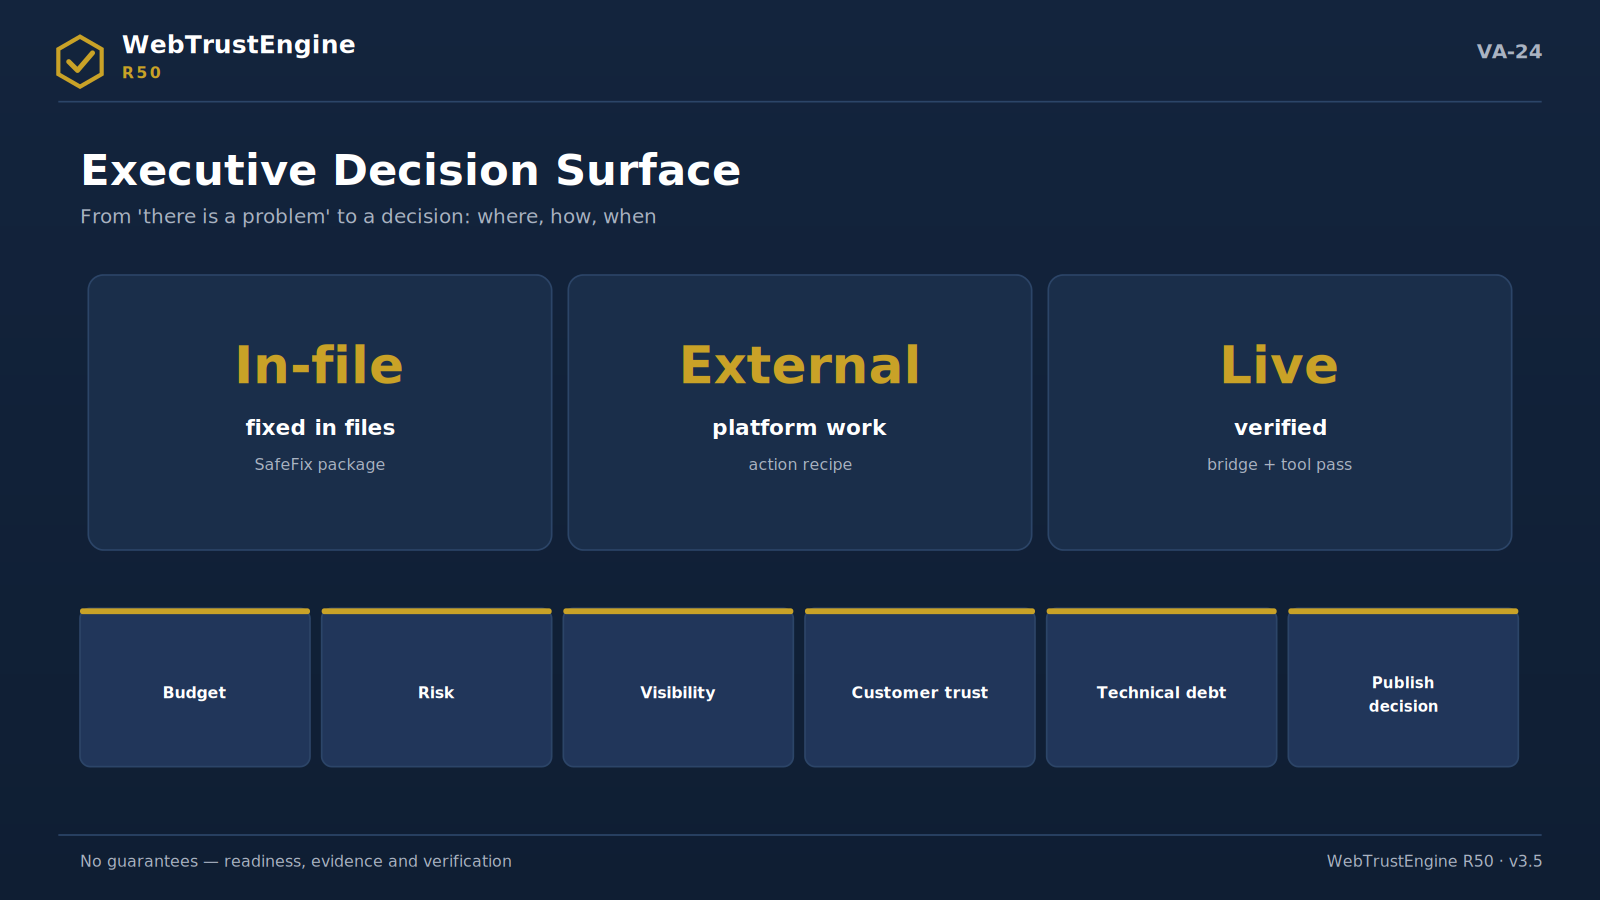
The decision surface: where each finding is resolved, in executive language.

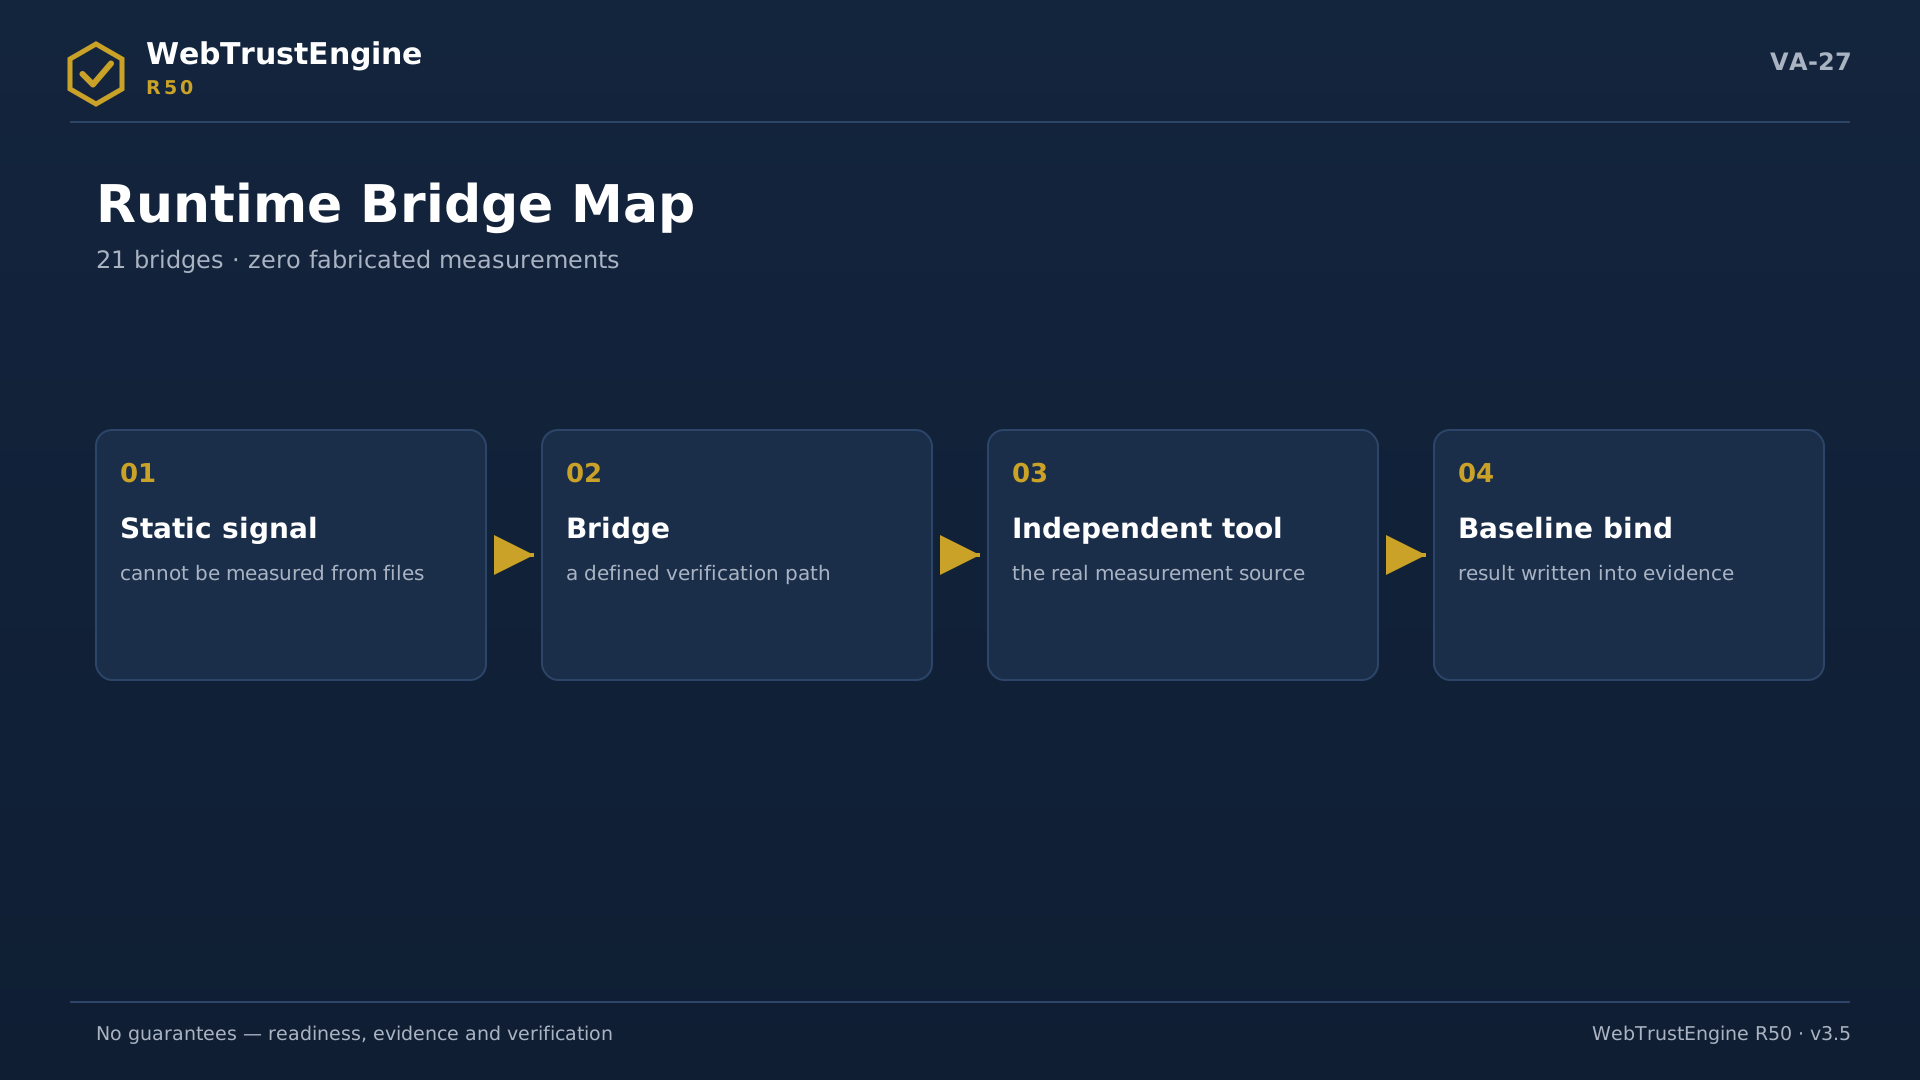
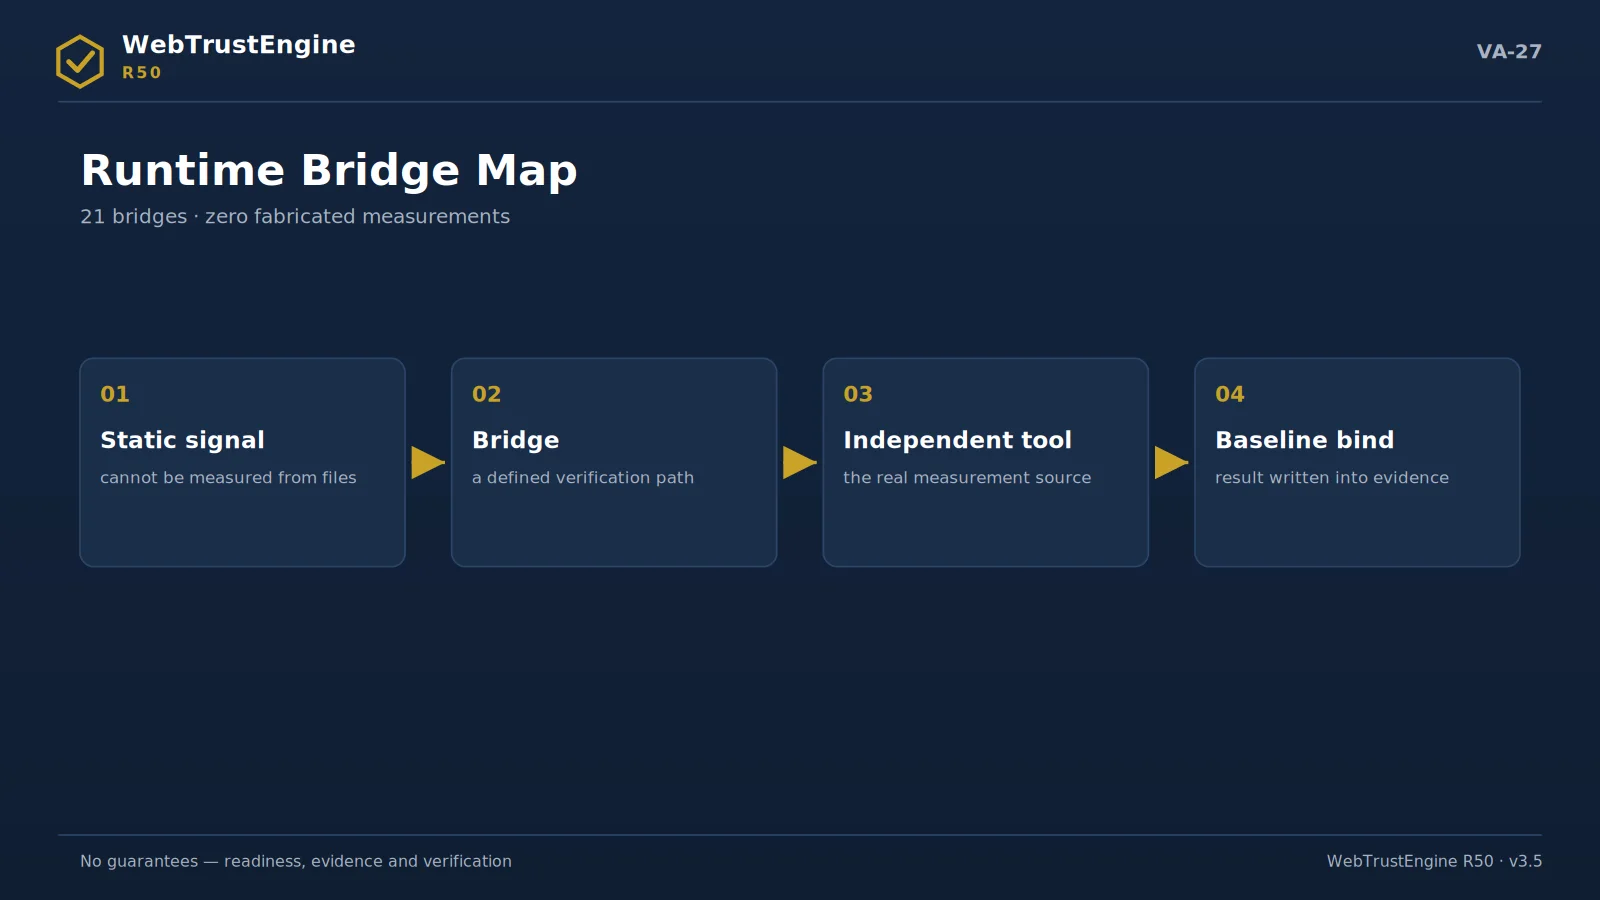
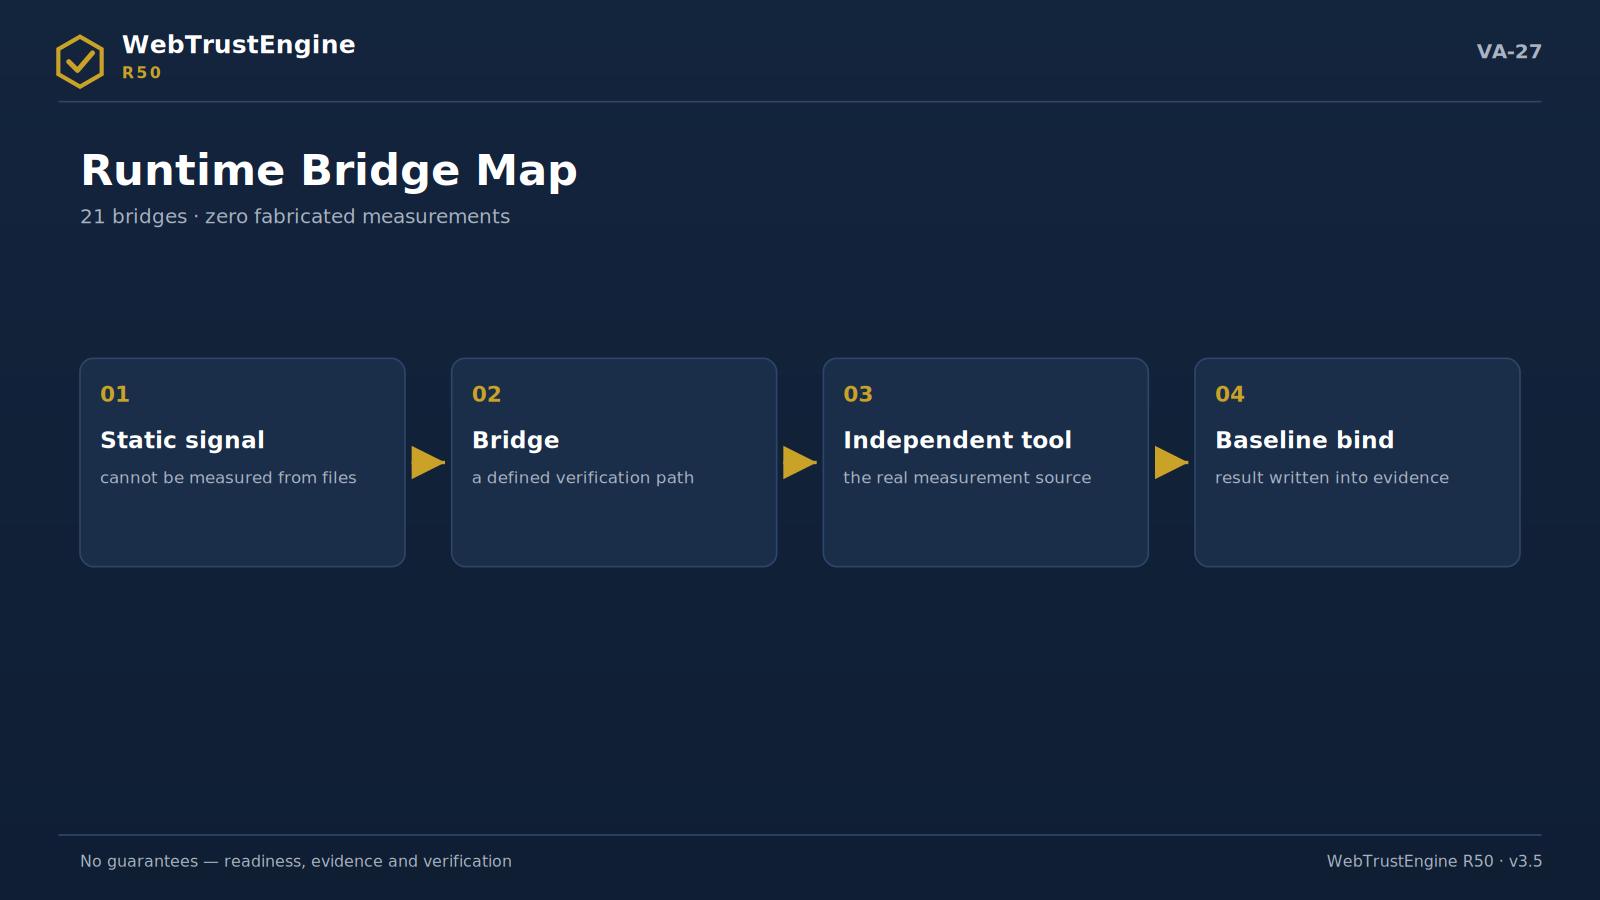
The runtime bridge: four steps from static signal to independent measurement.

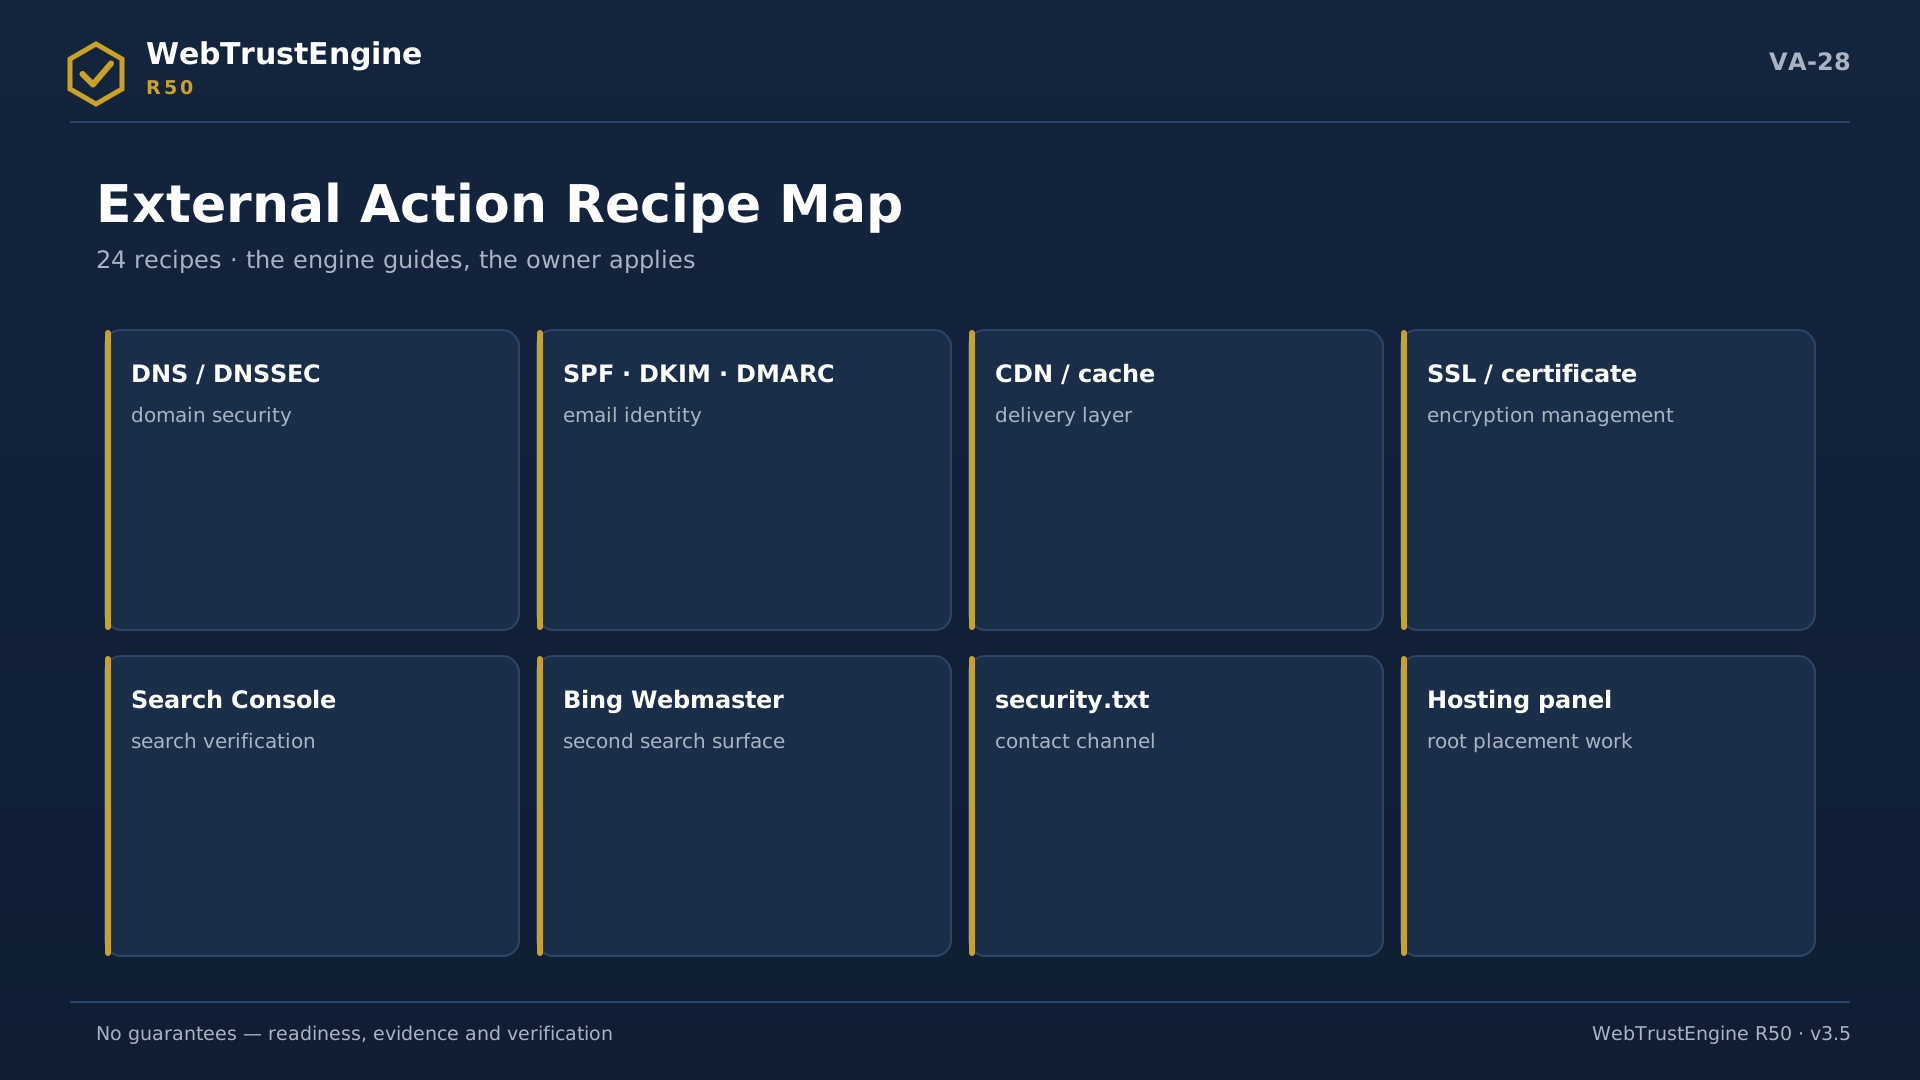
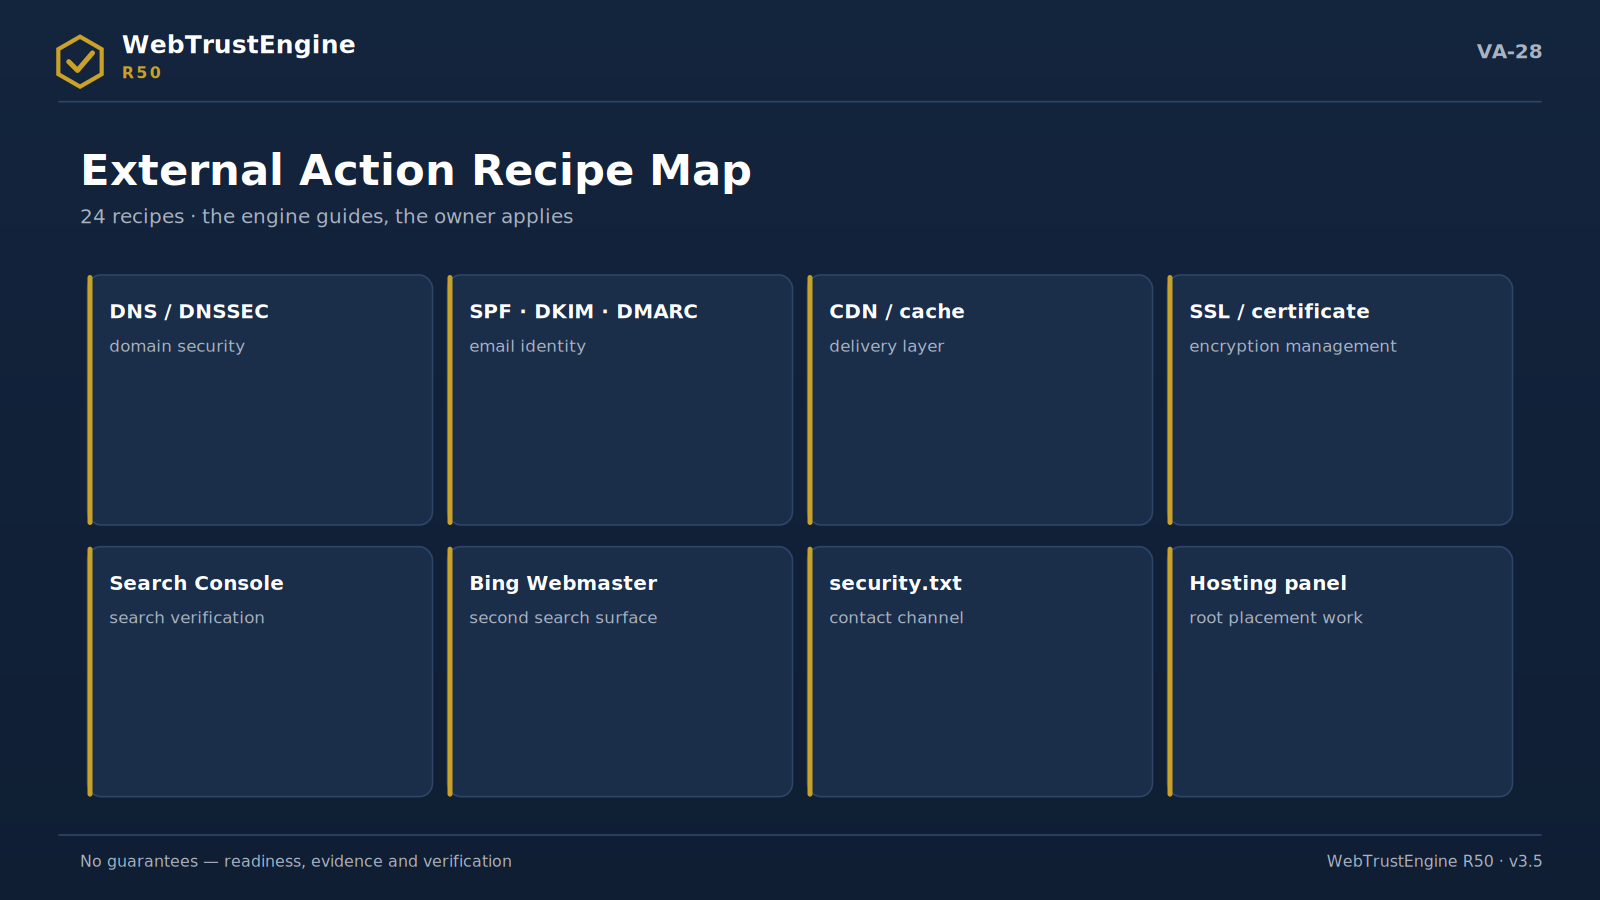
The external action map: eight platform areas the engine cannot change in files.
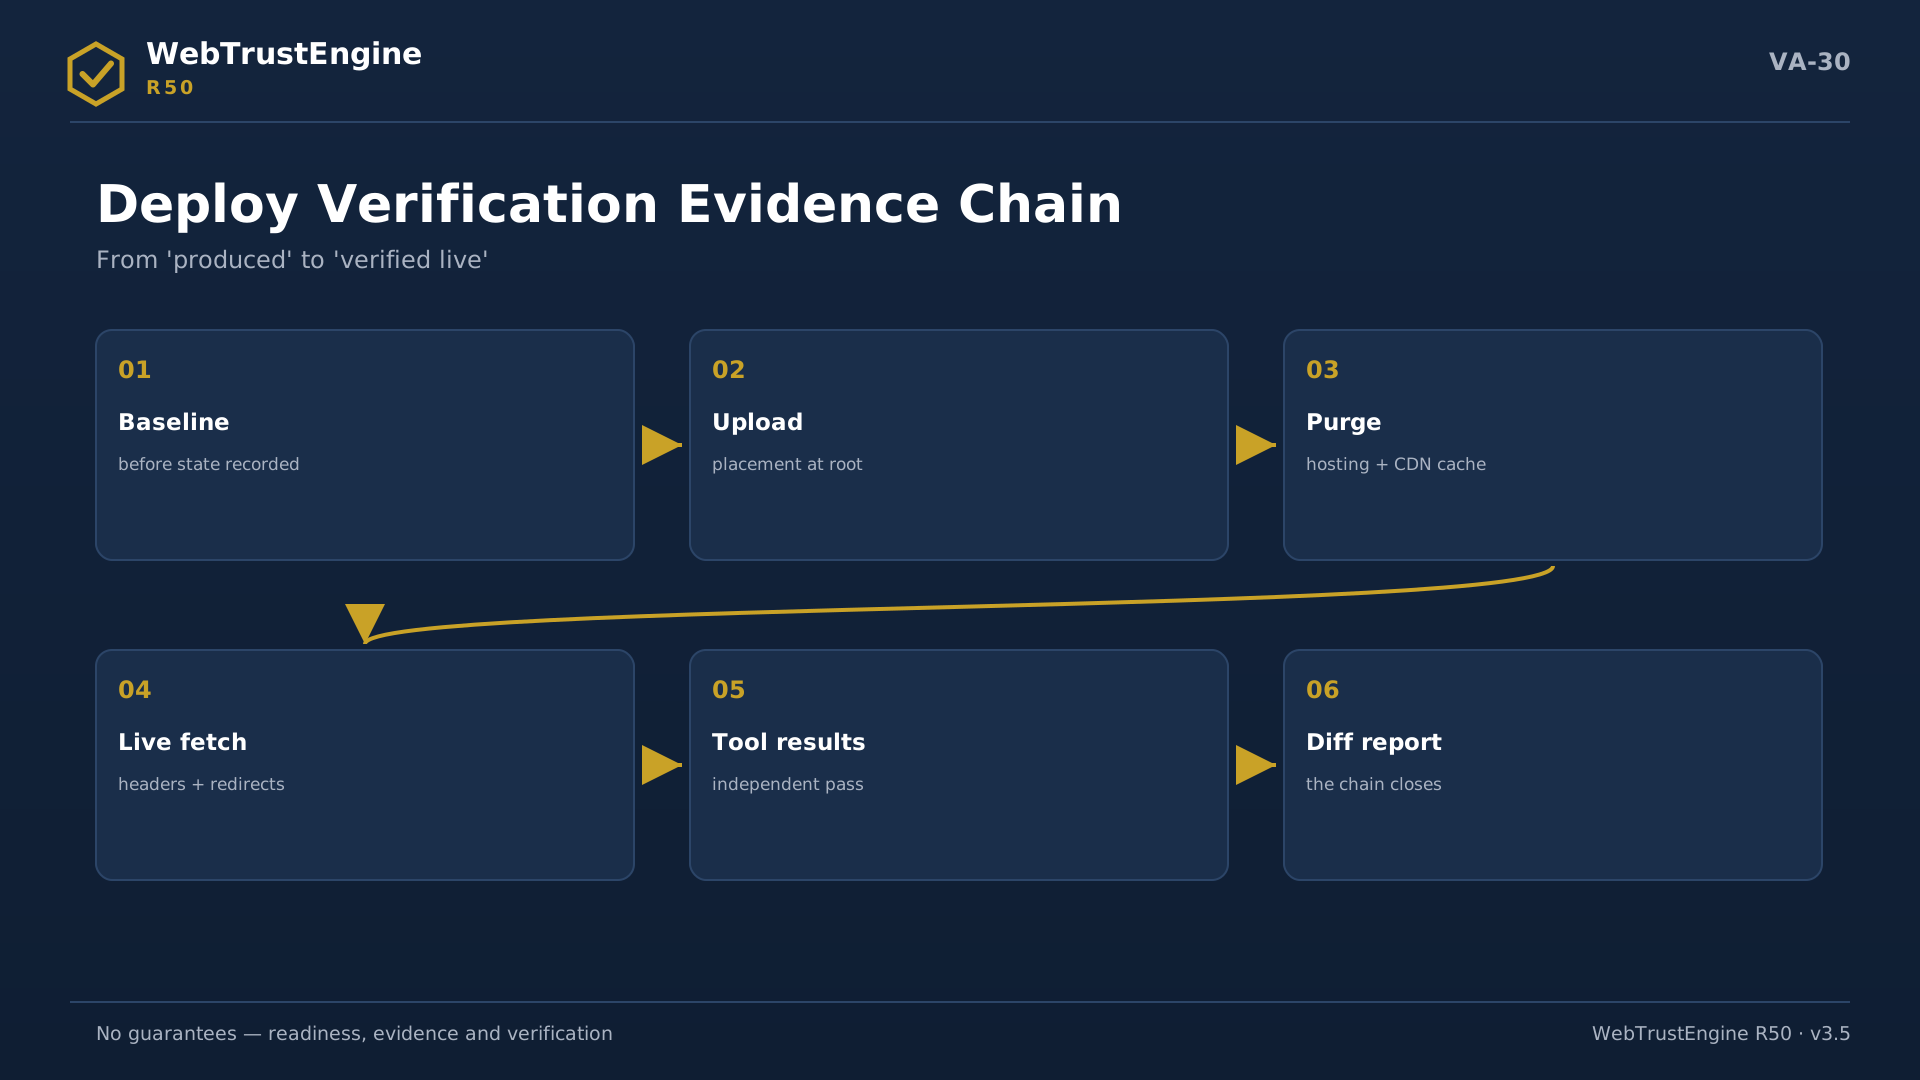
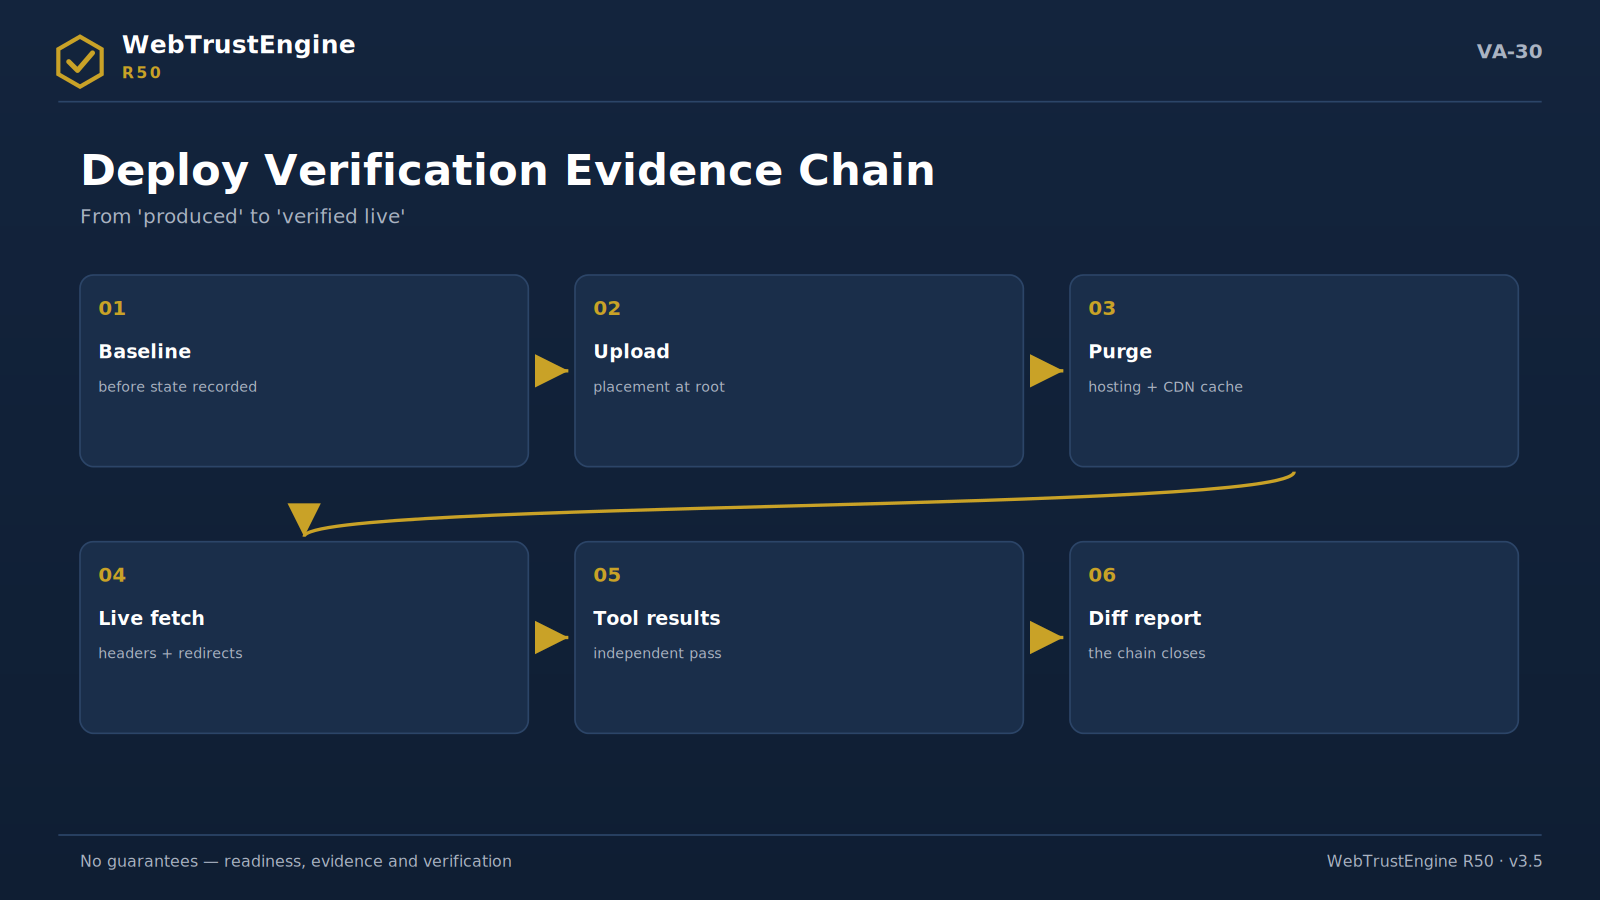
The evidence chain: six links from the baseline record to the diff report.

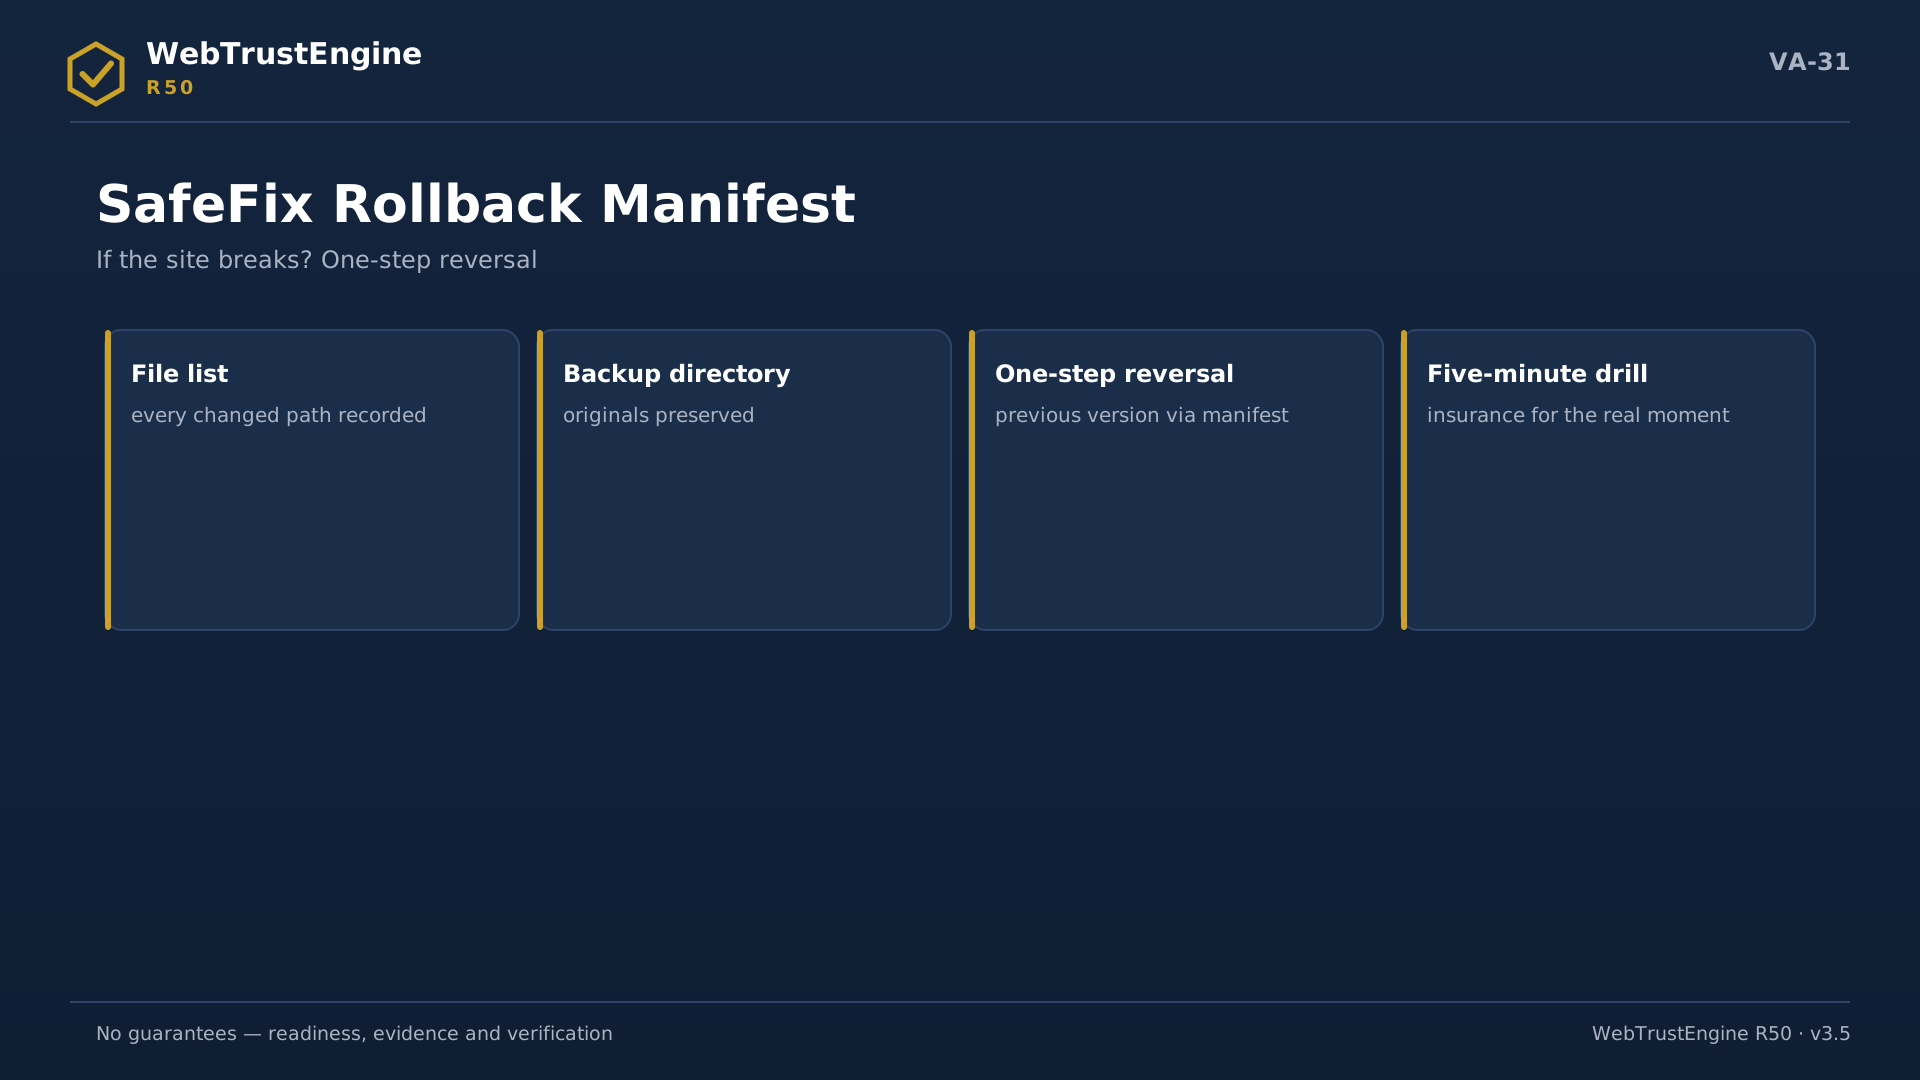
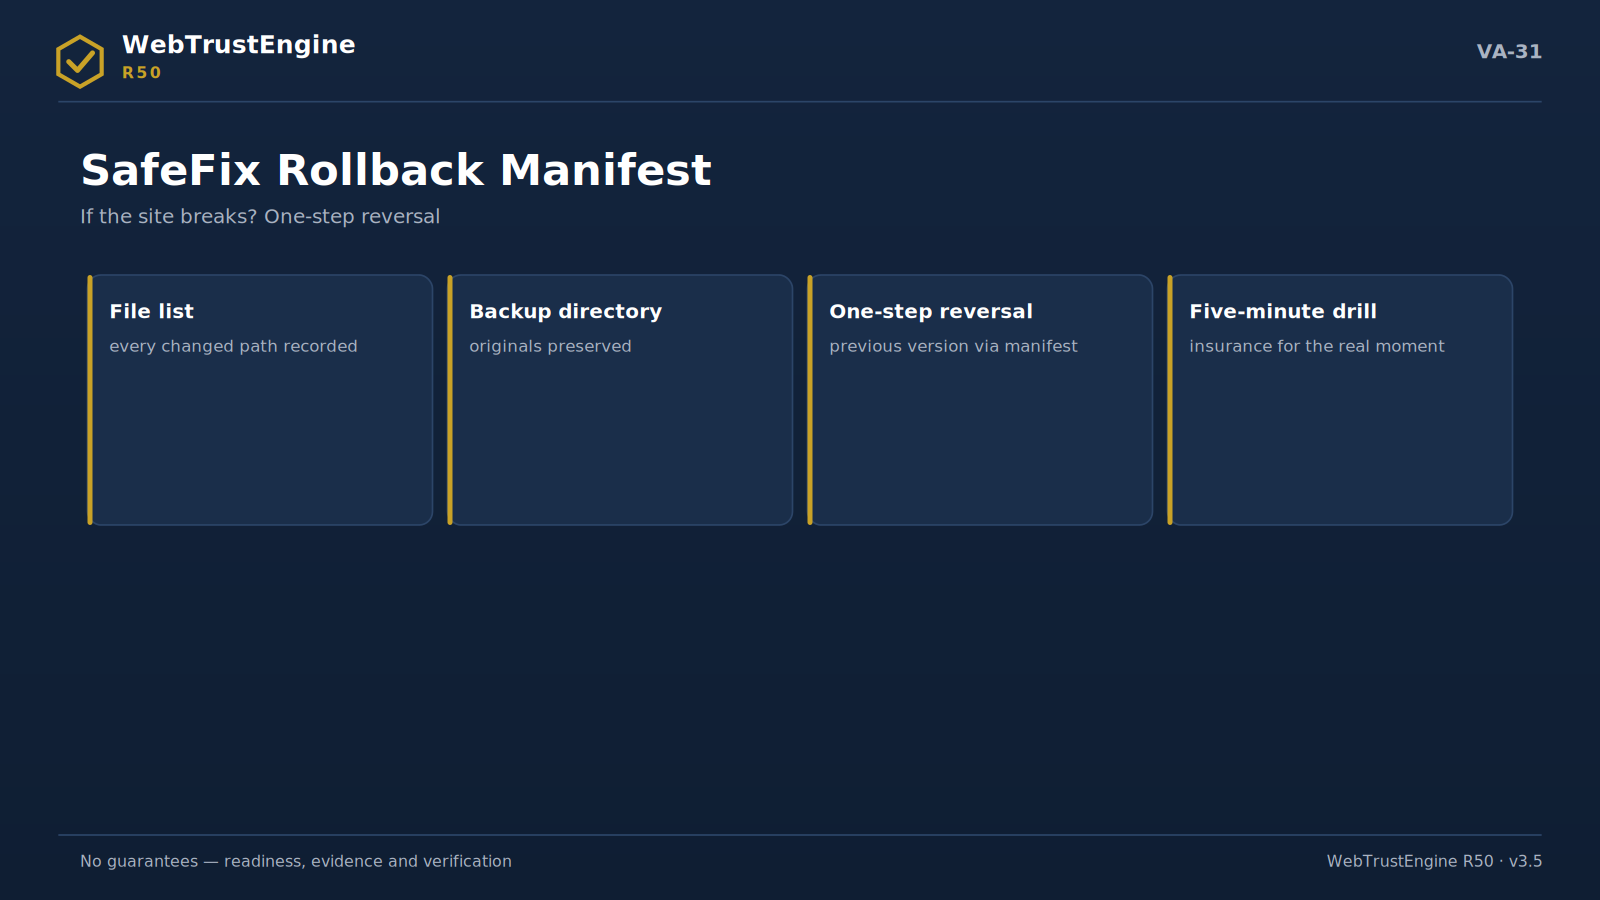
The rollback manifest: file list, backup, one-step reversal and the drill.
Architecture and service layers

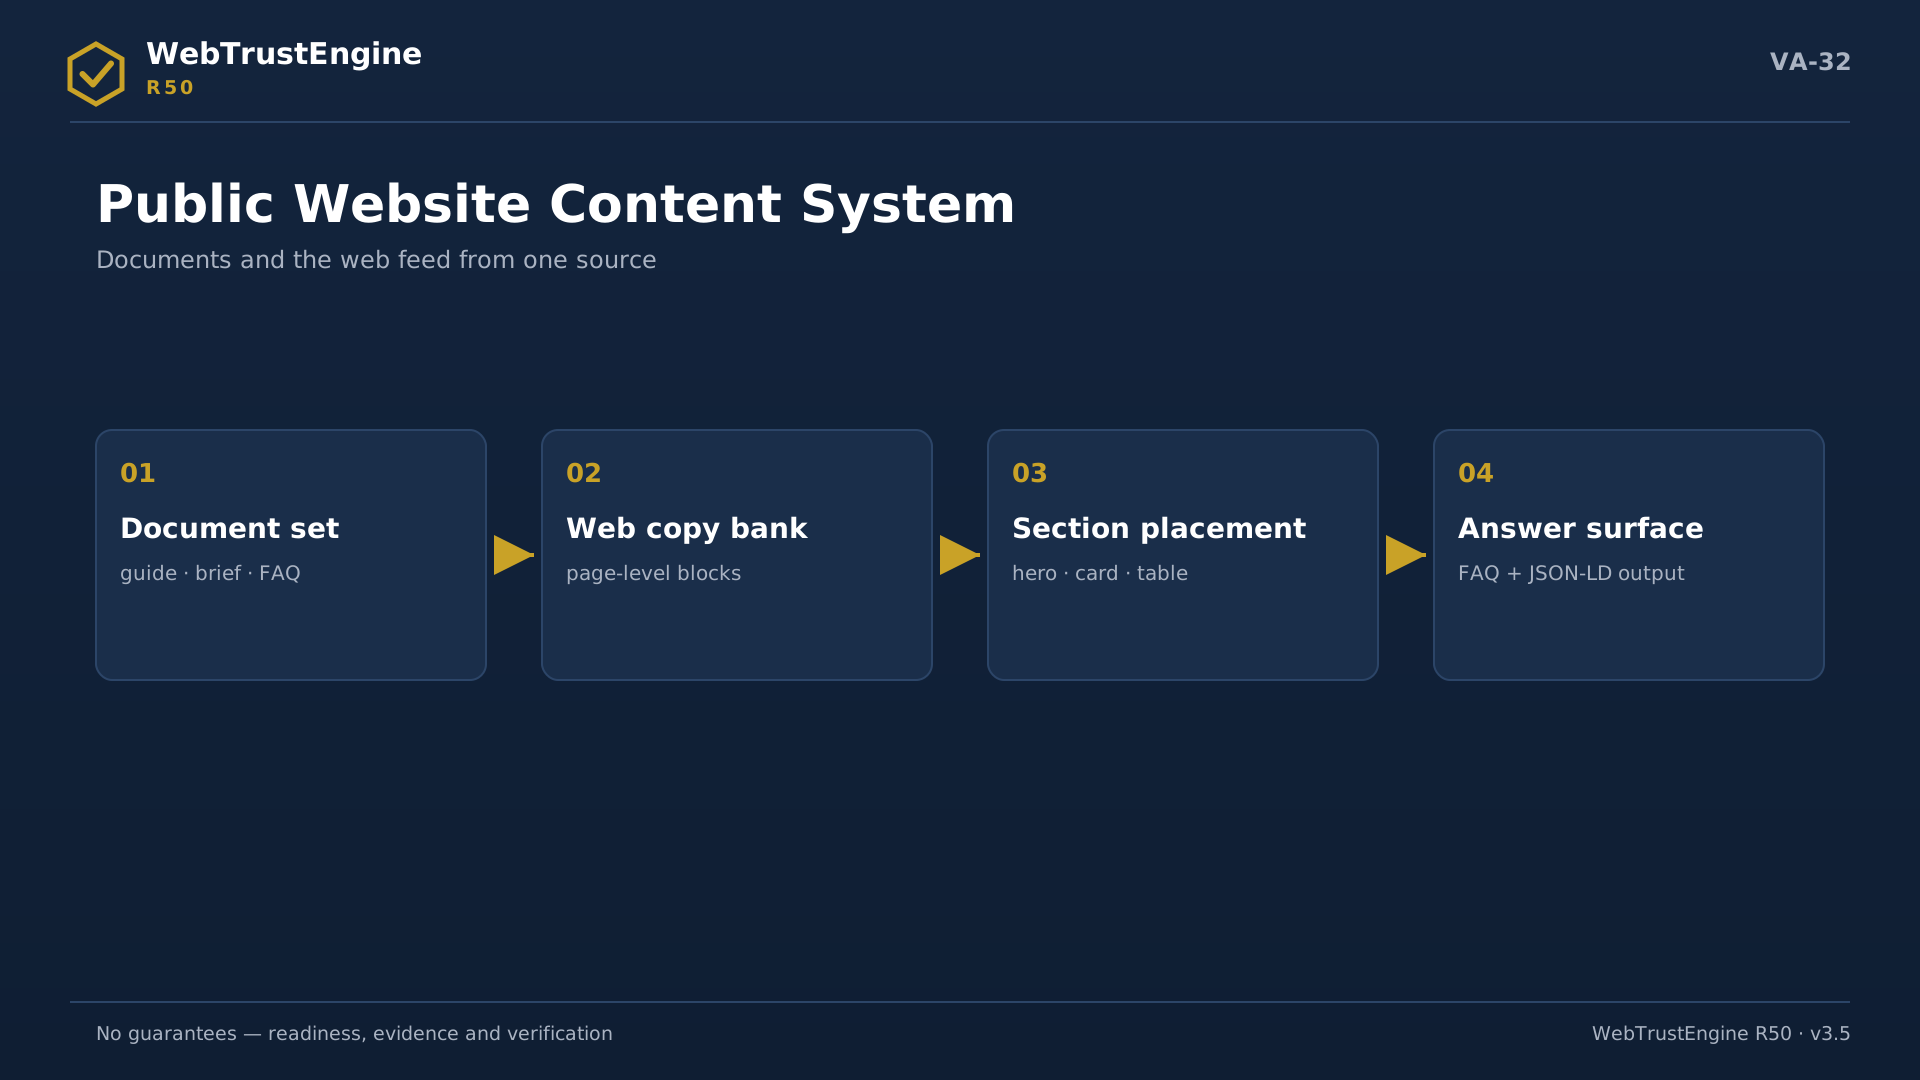
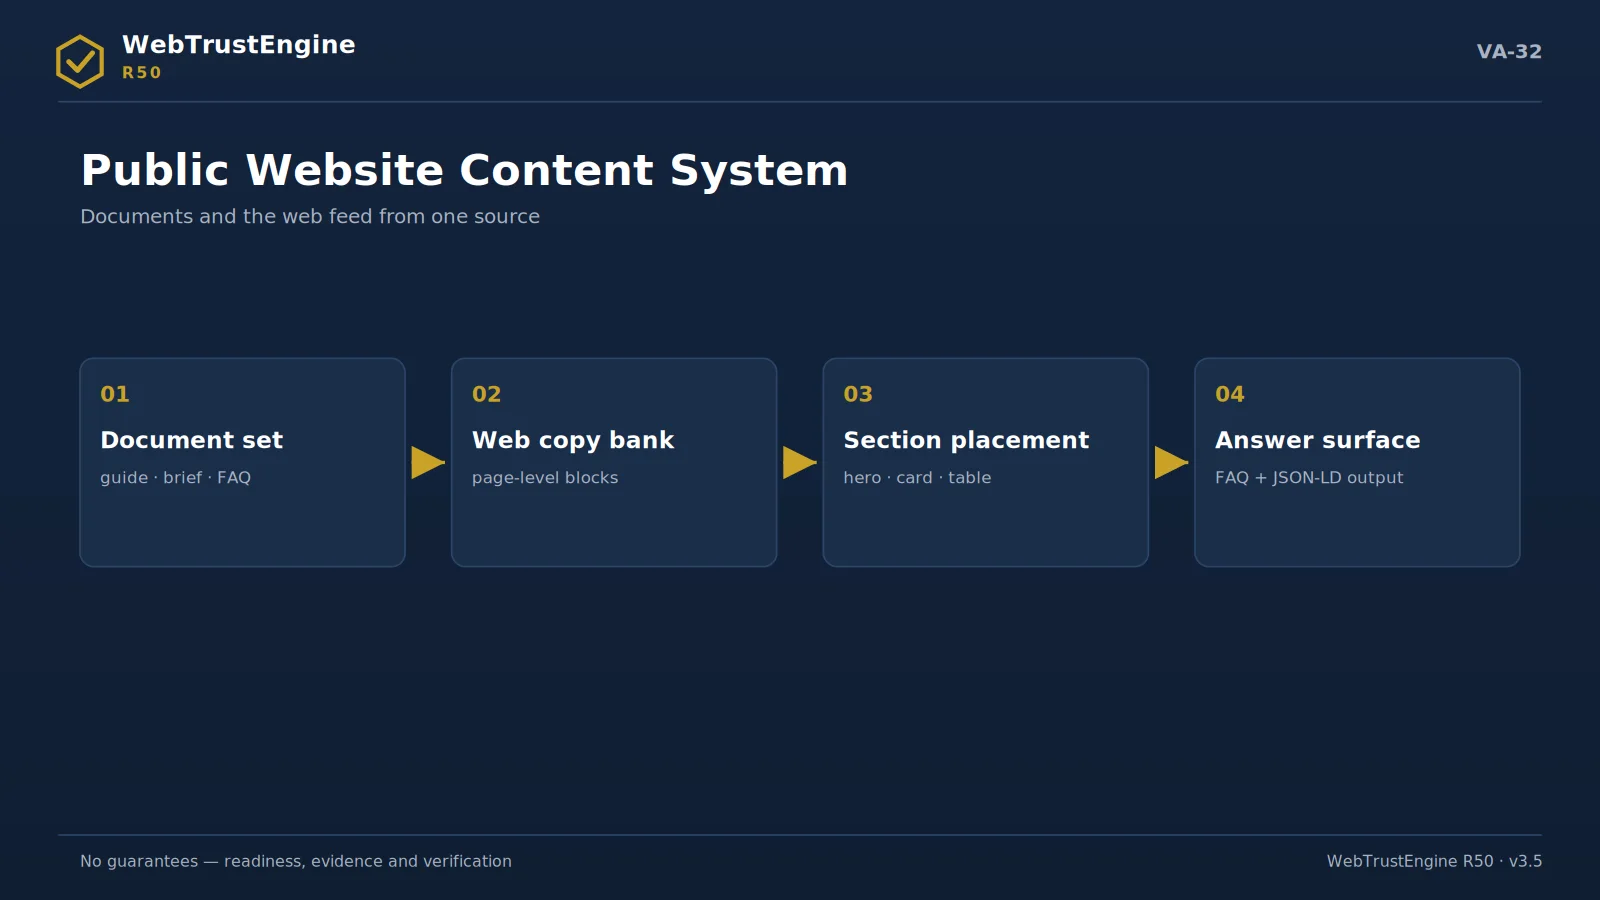
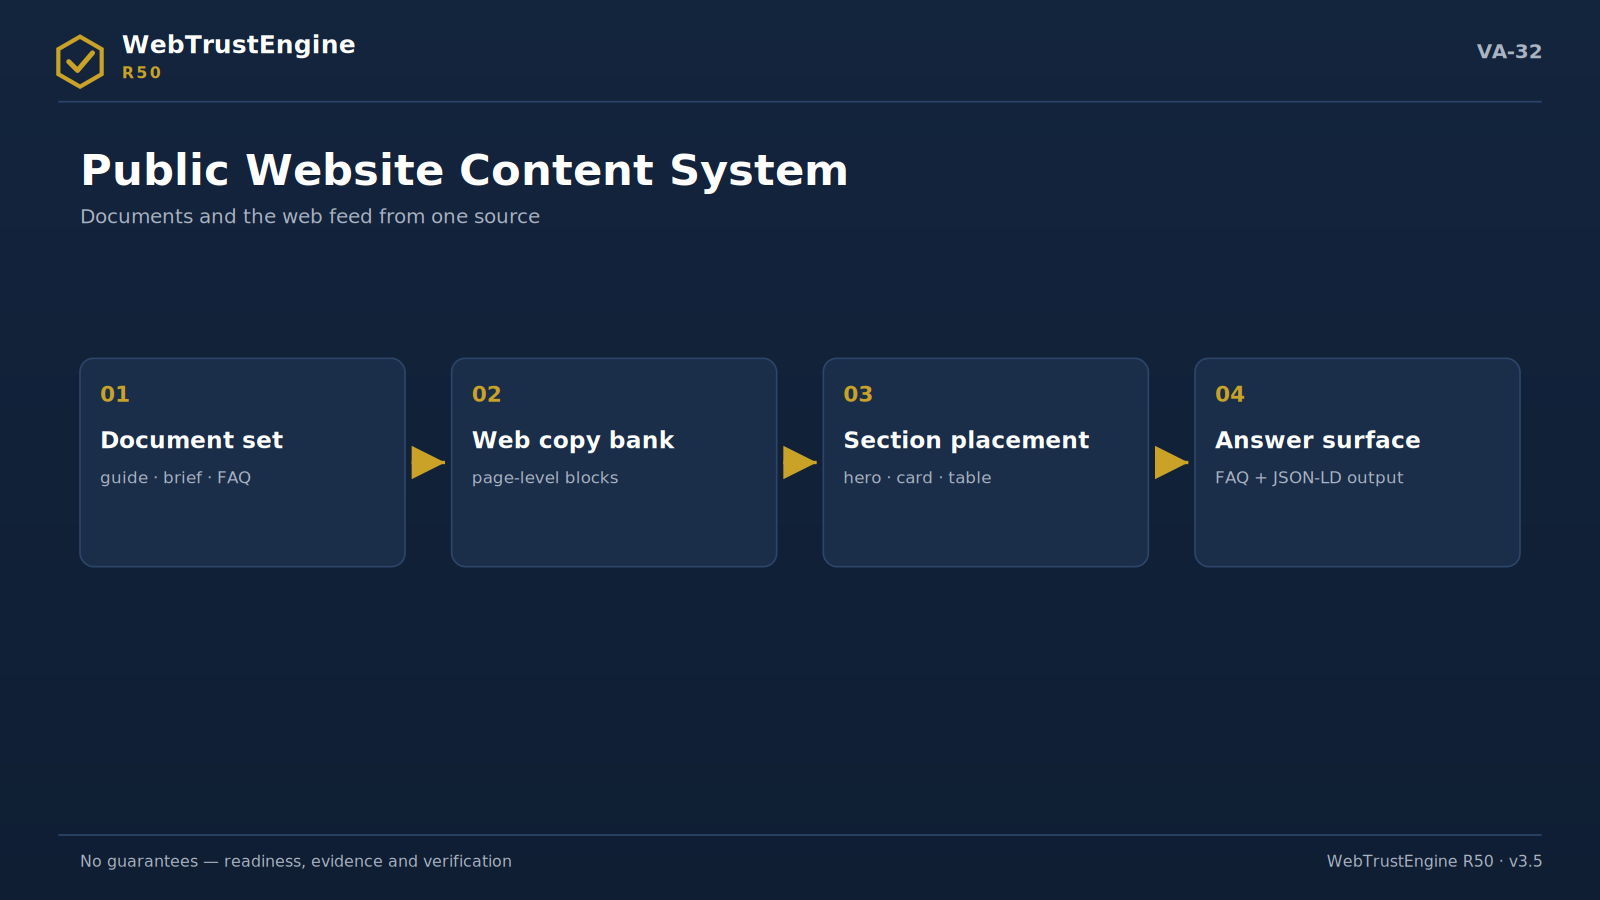
The content system: one line from documents to web sections and the answer surface.

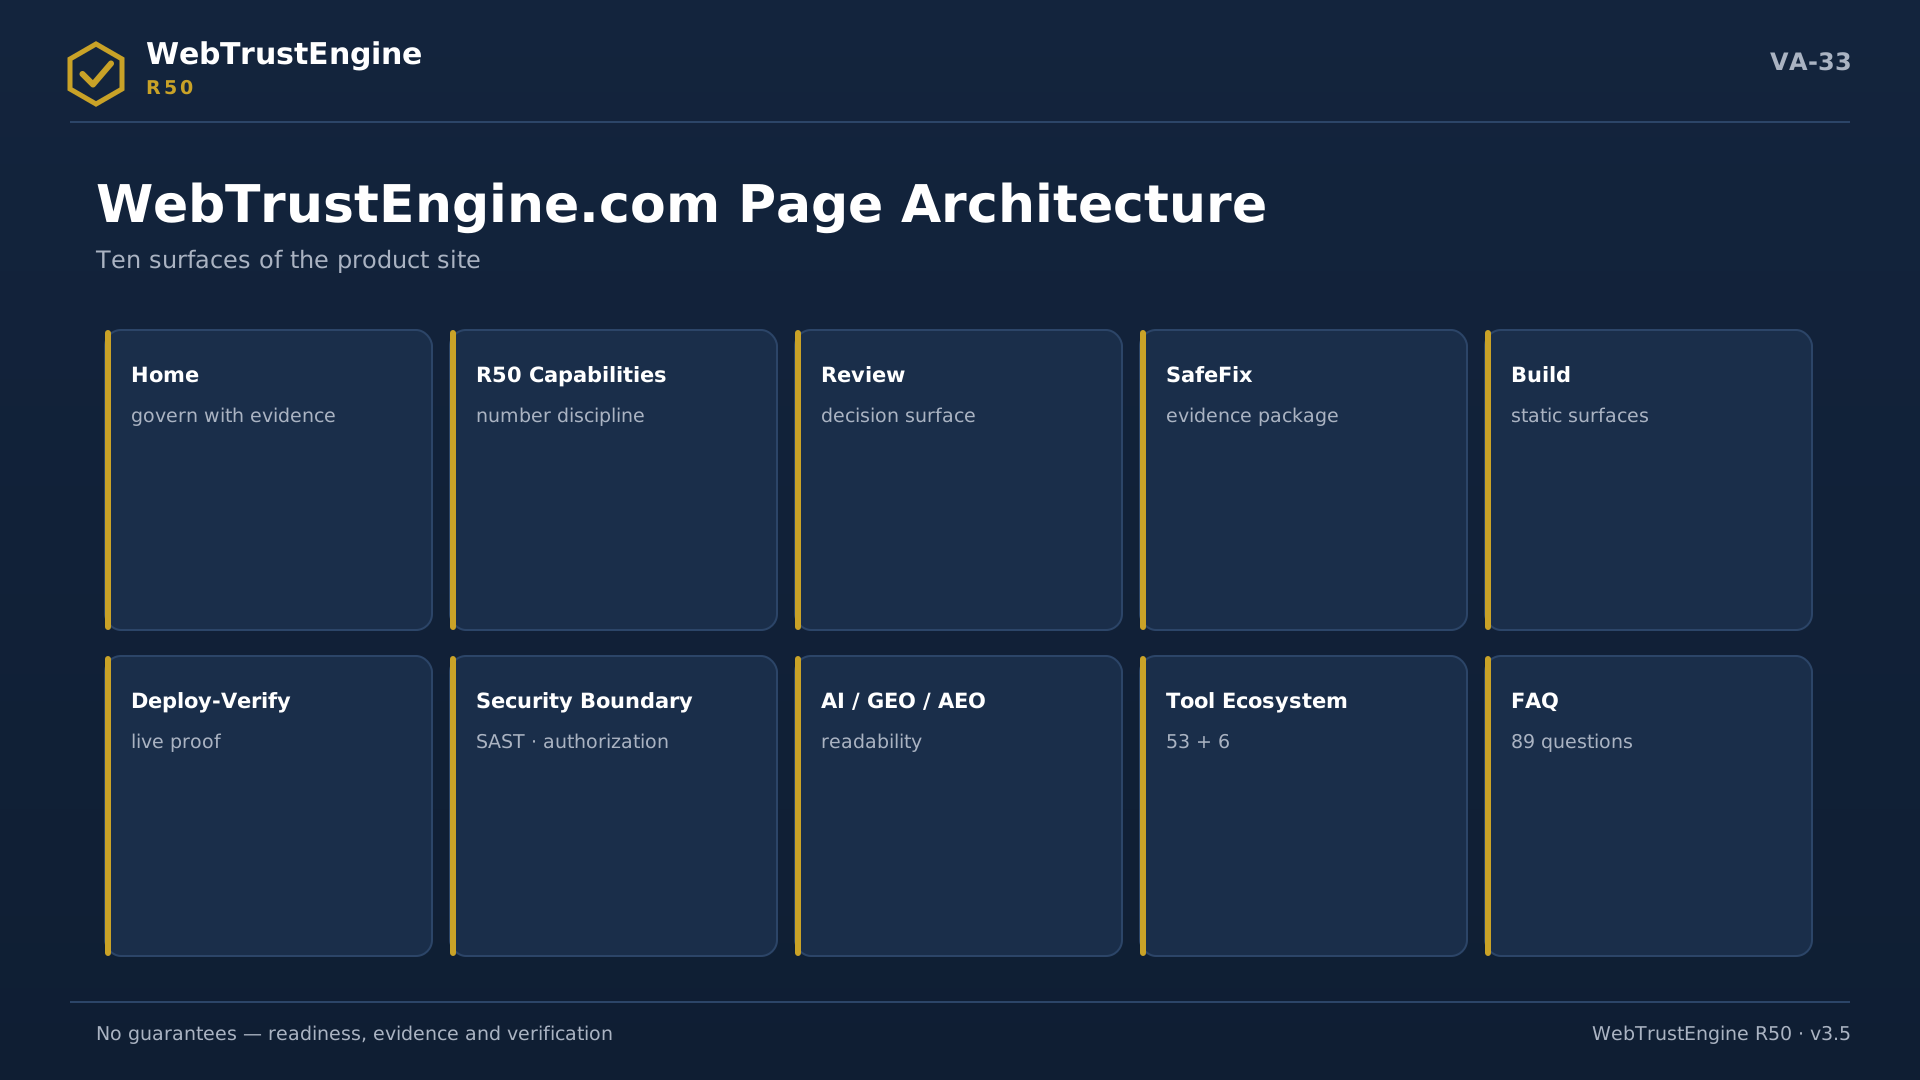
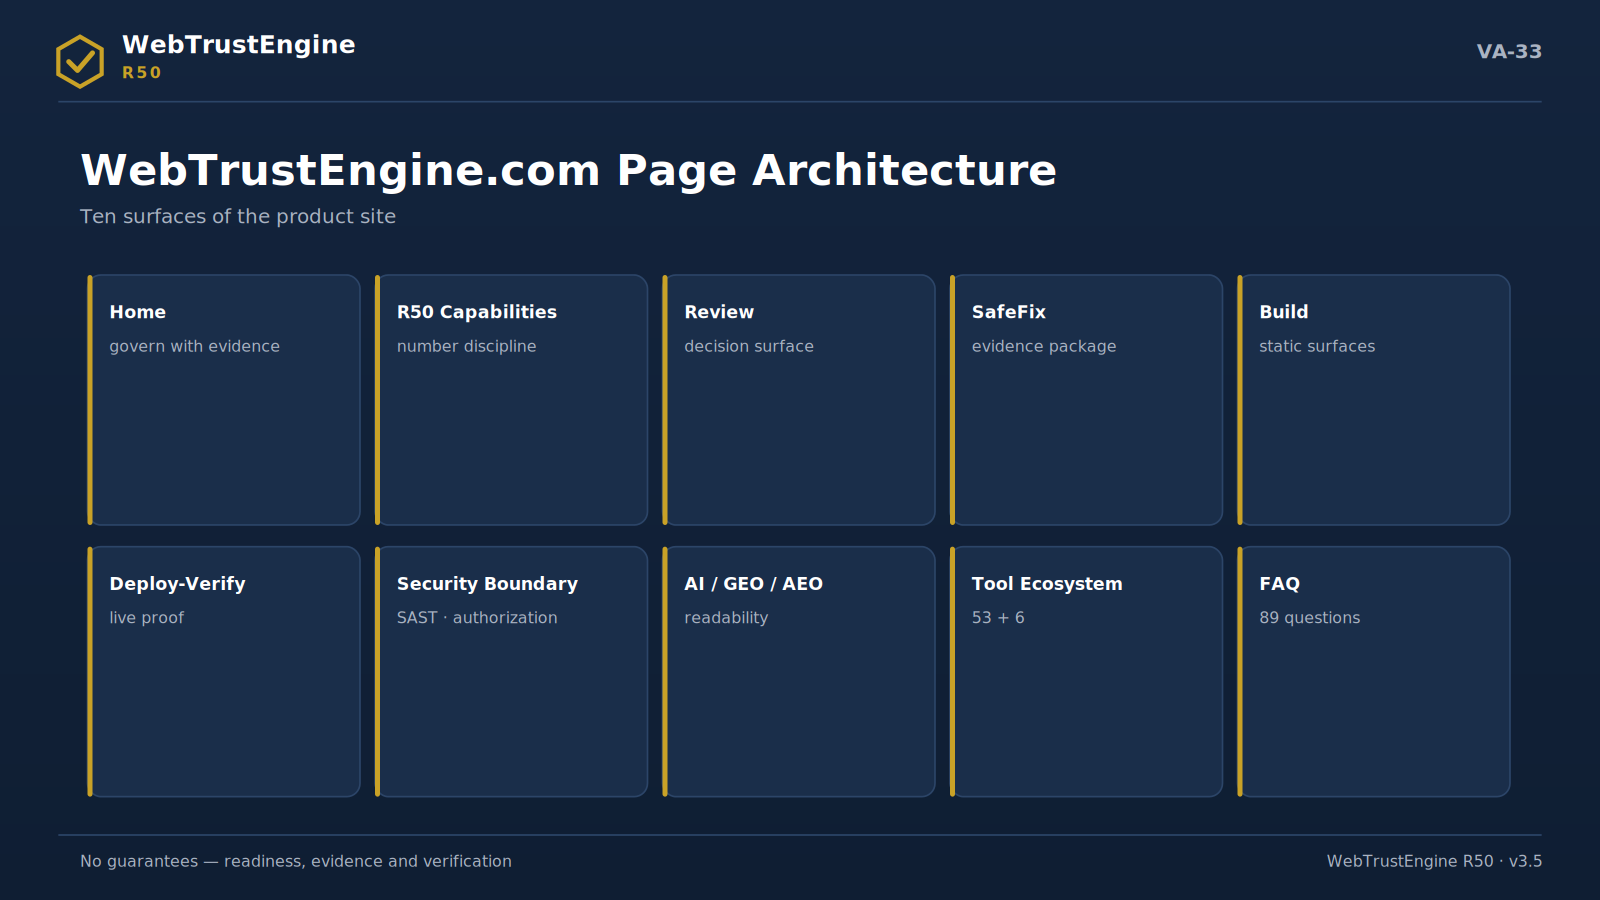
The page architecture: ten product surfaces from Home to FAQ.
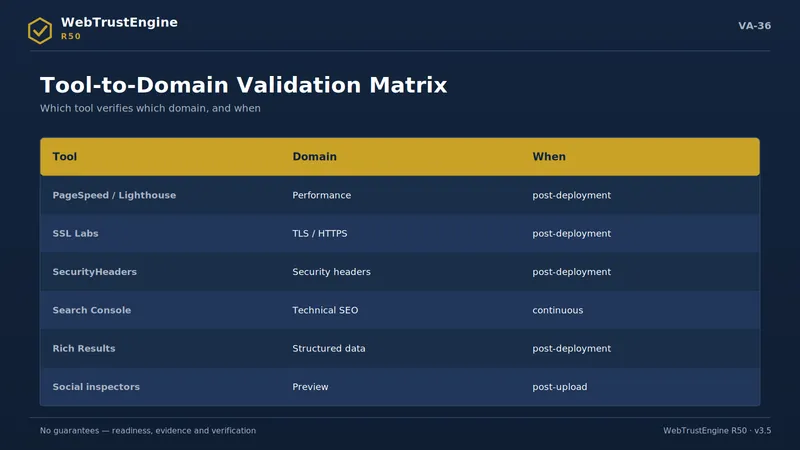
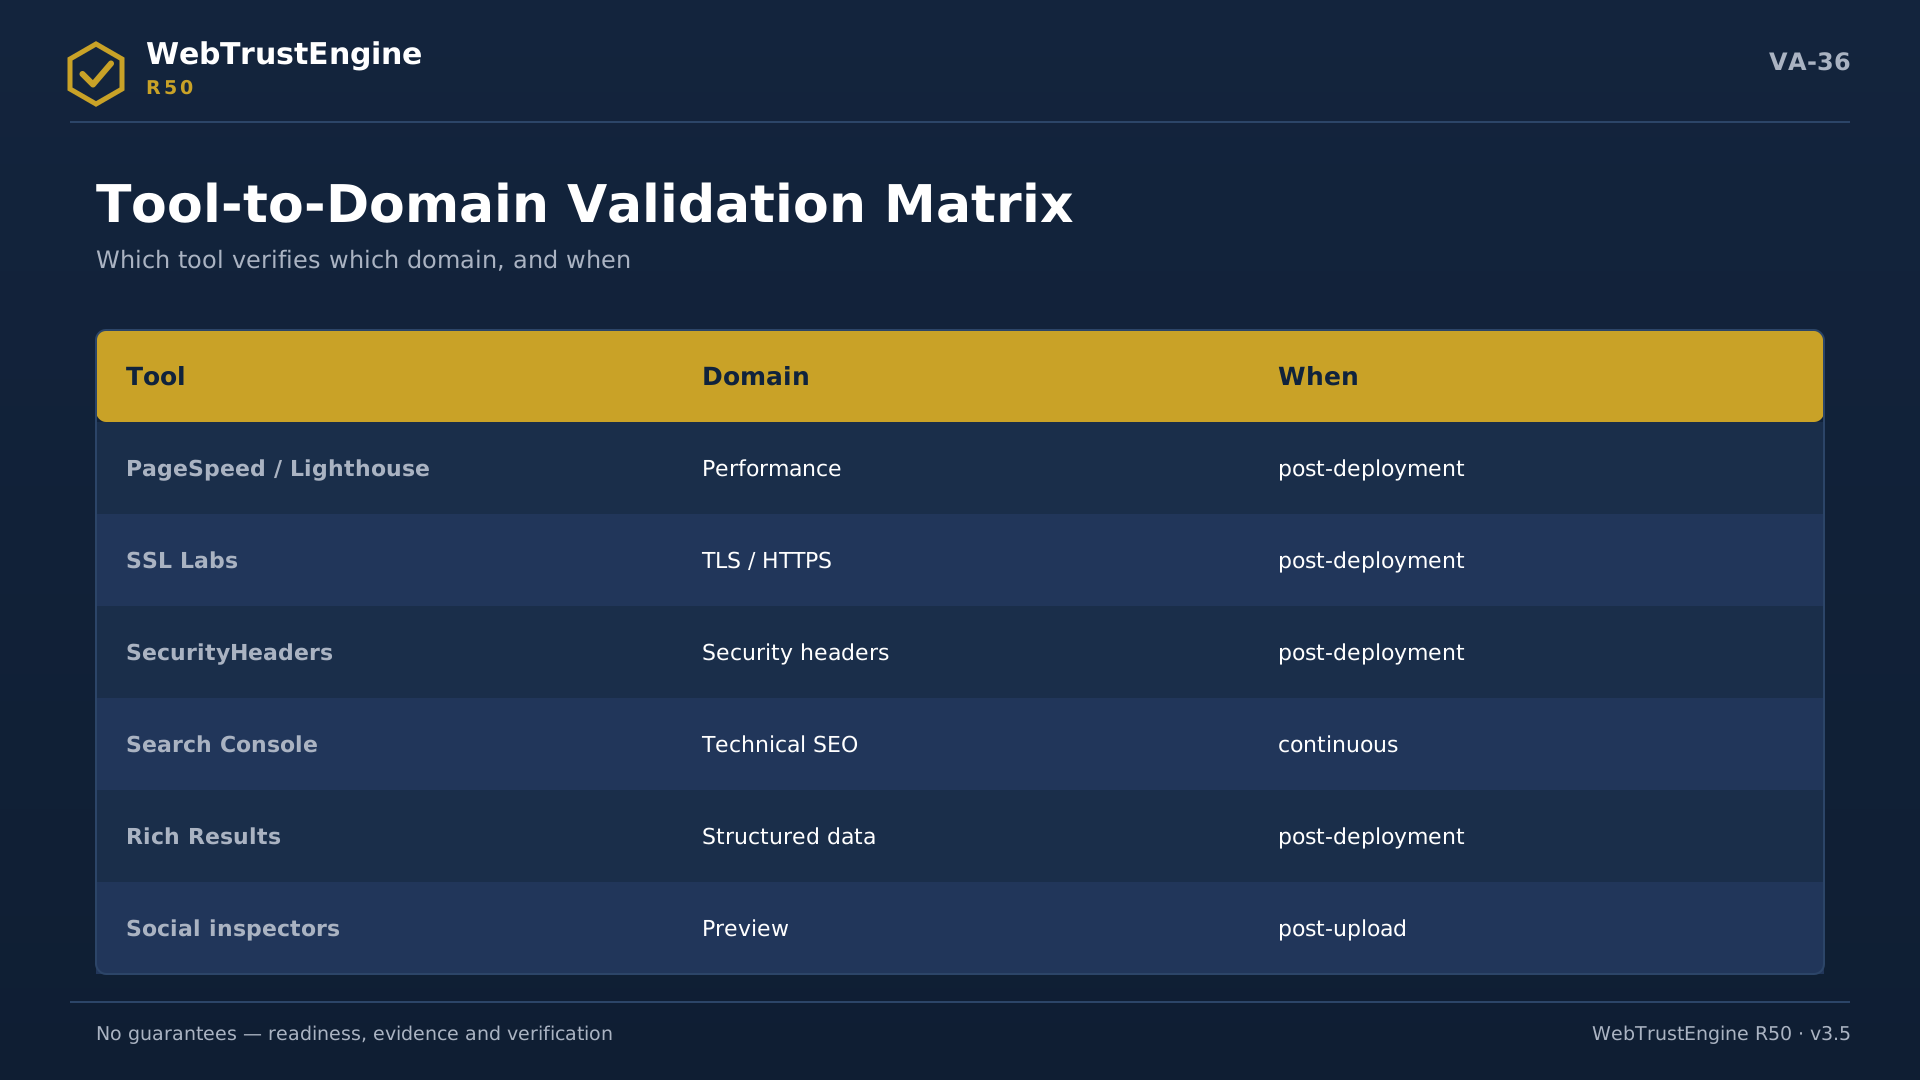
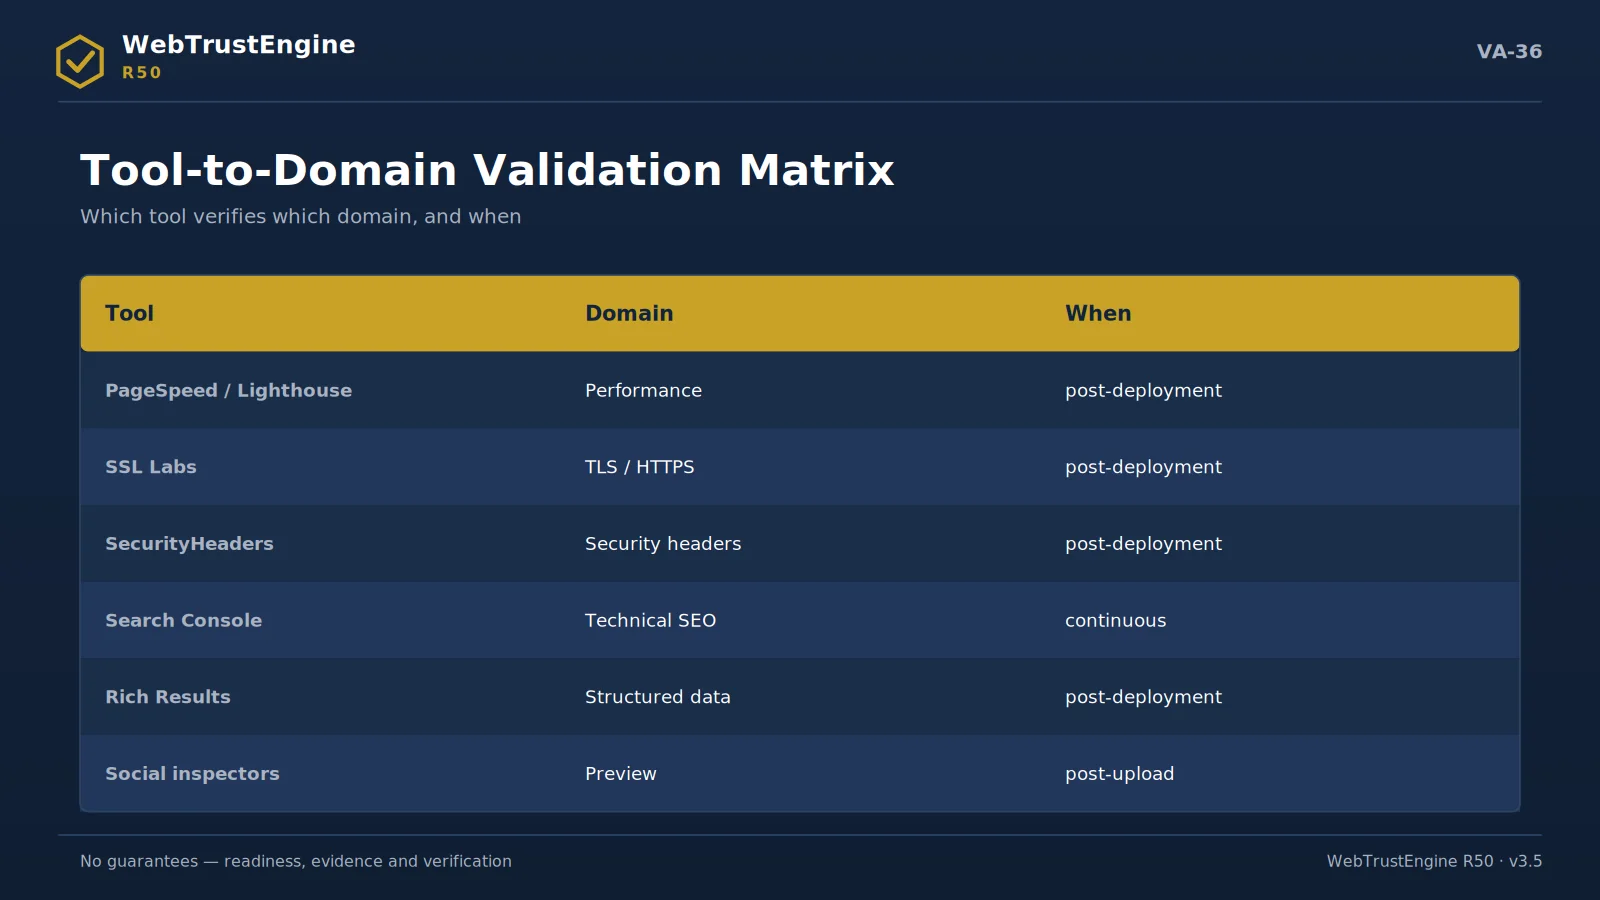
The tool-to-domain matrix: the domain and timing map of independent validation.


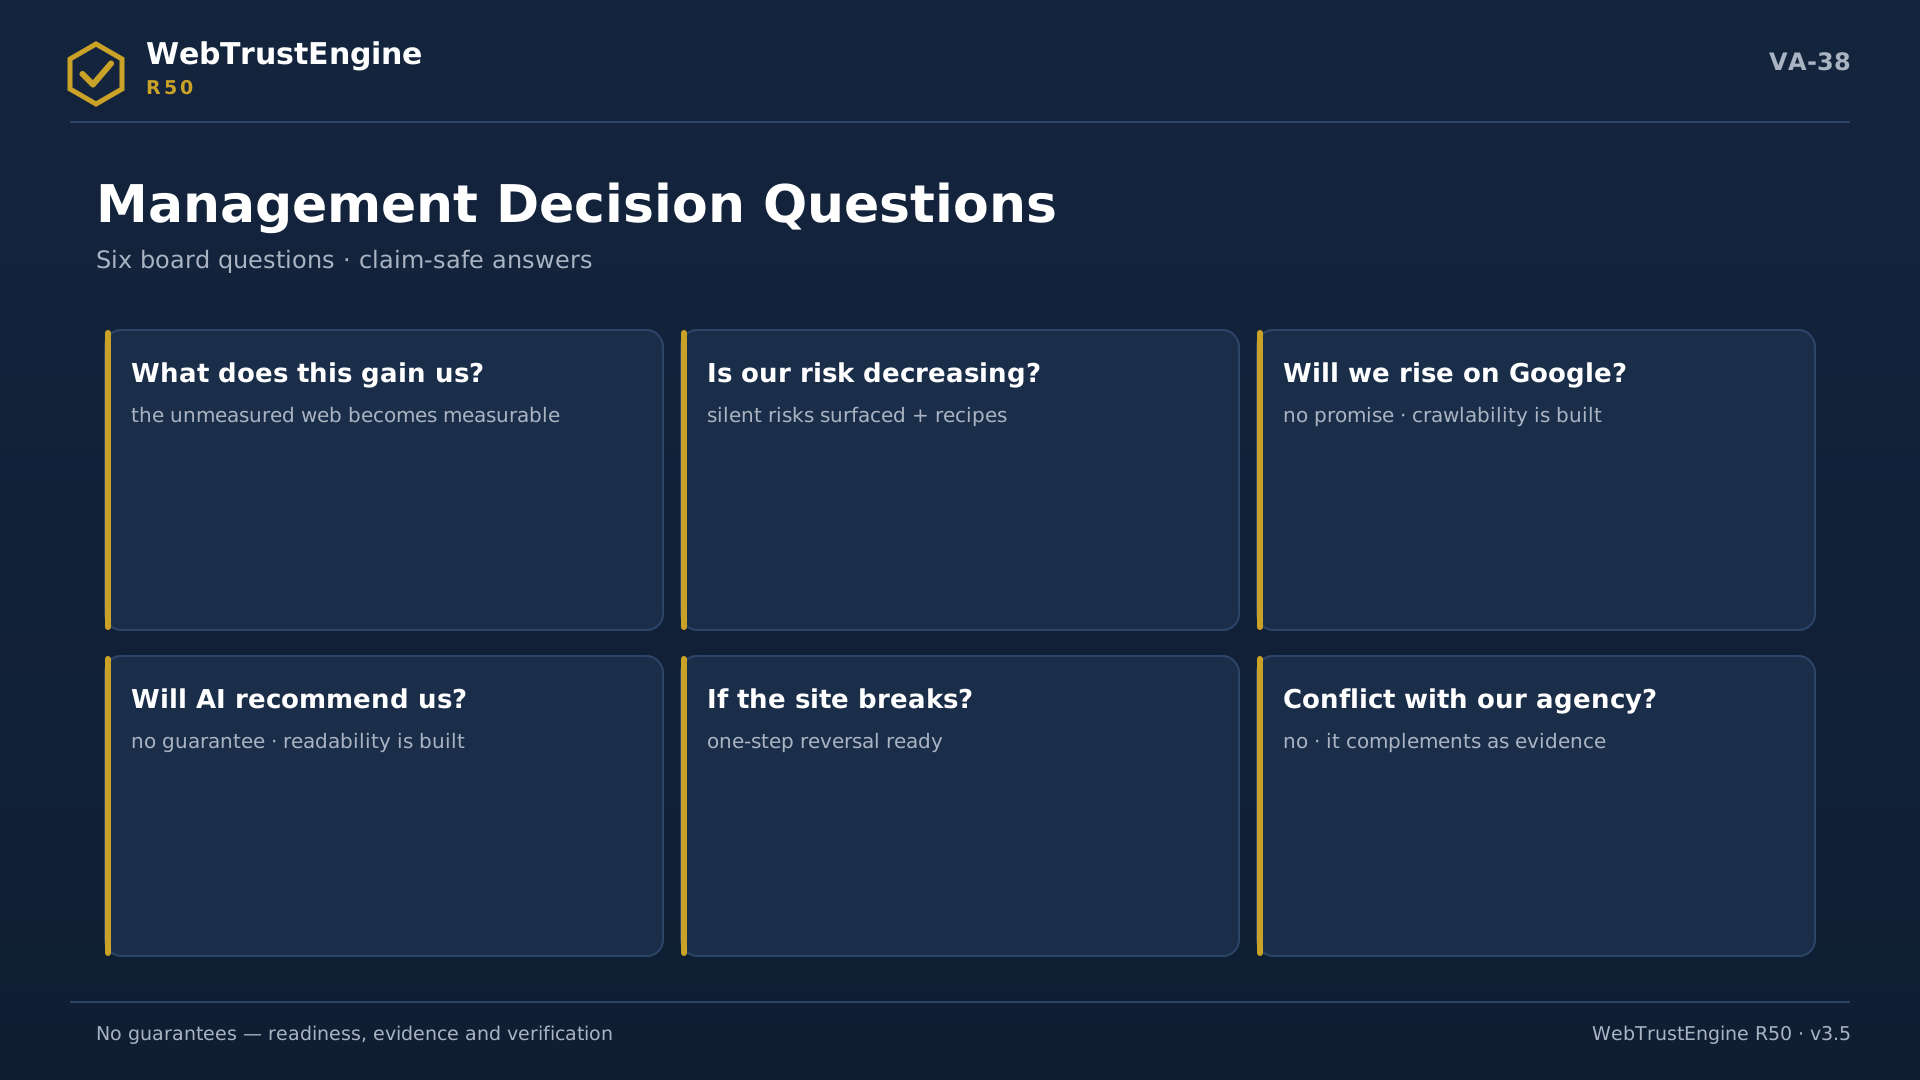
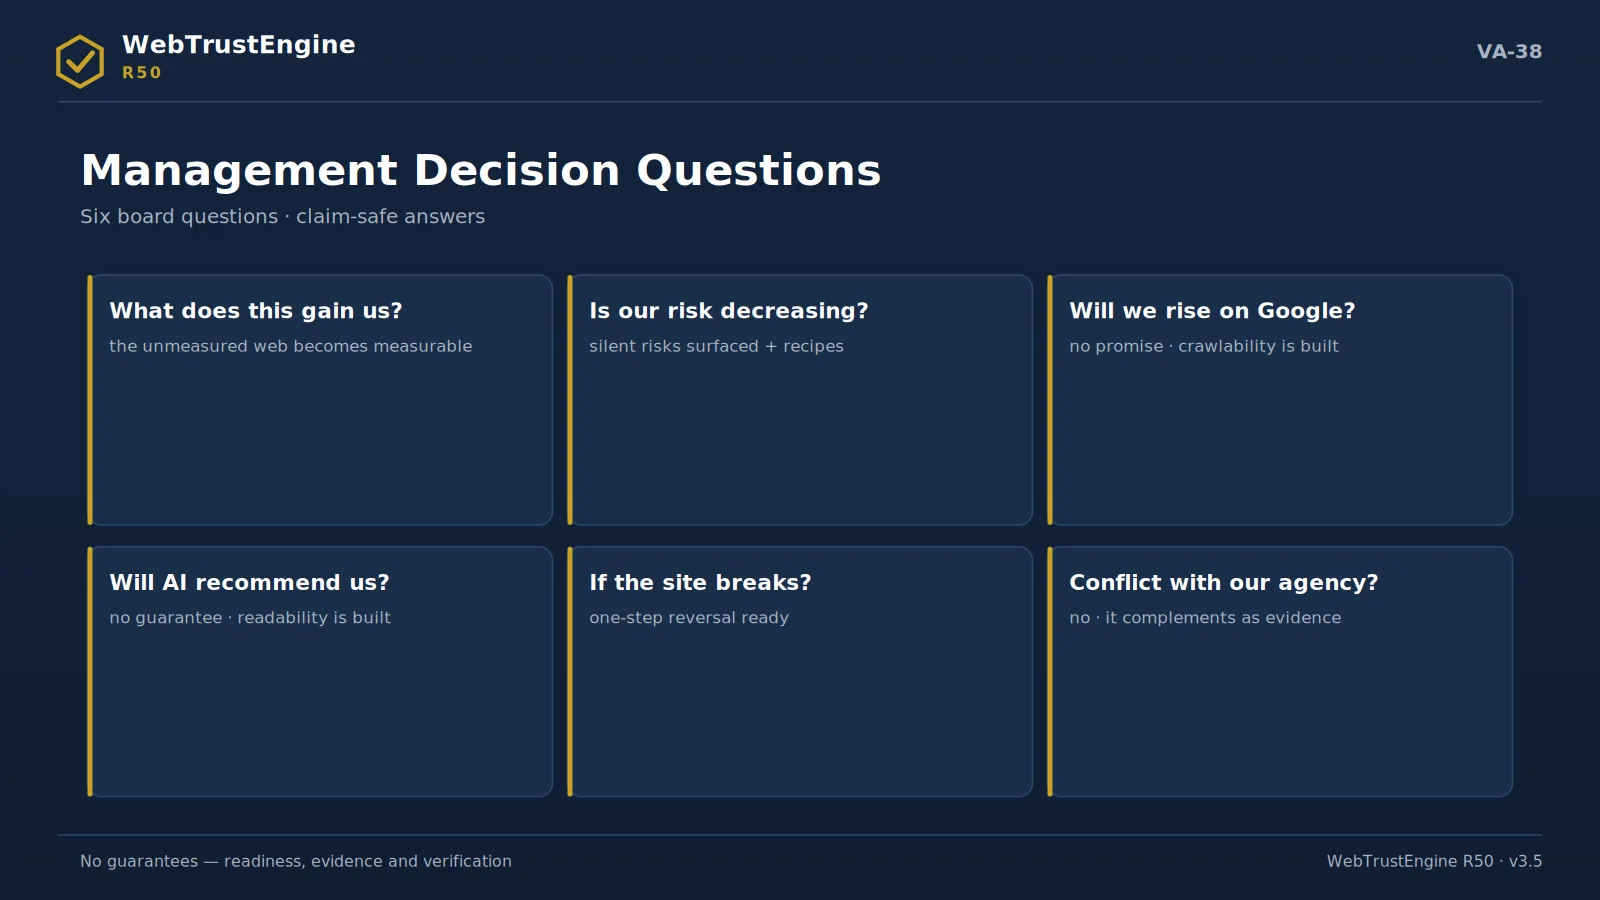
Management decision questions: claim-safe answers to six critical questions.


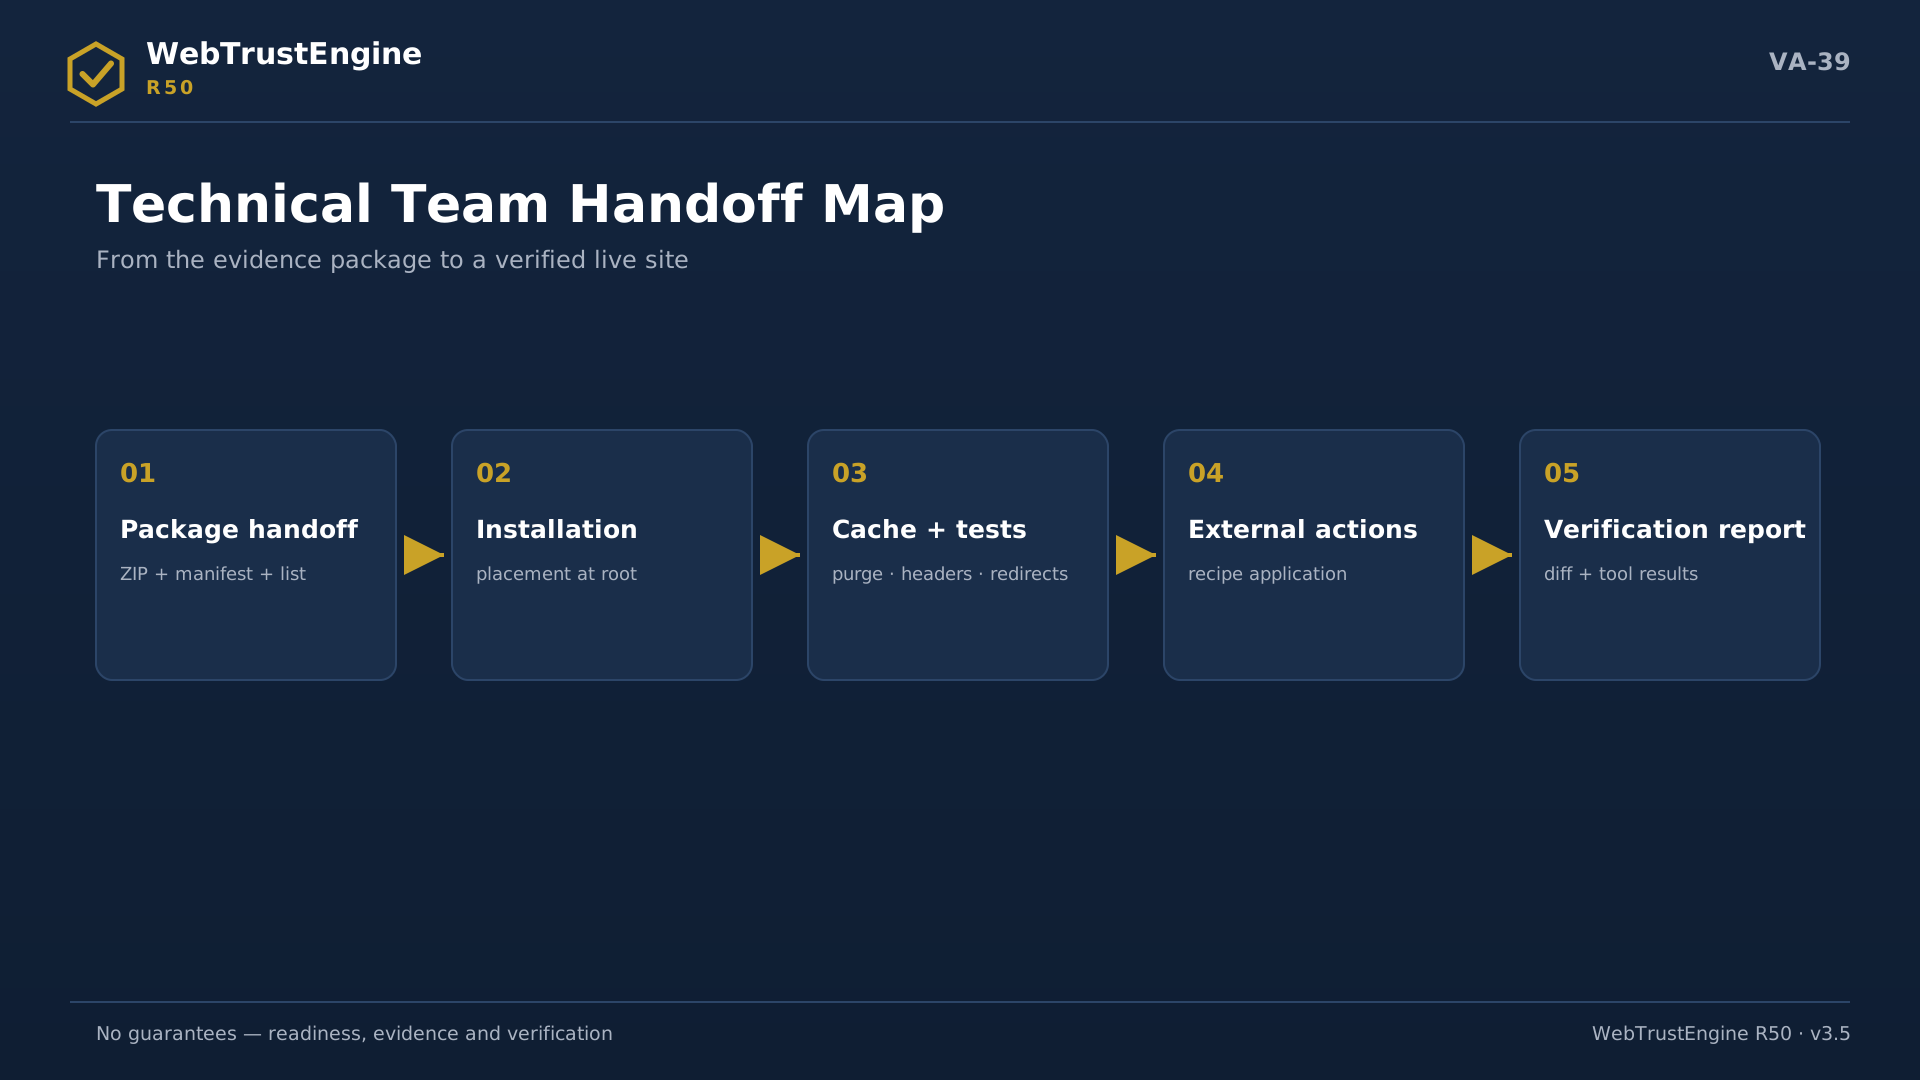
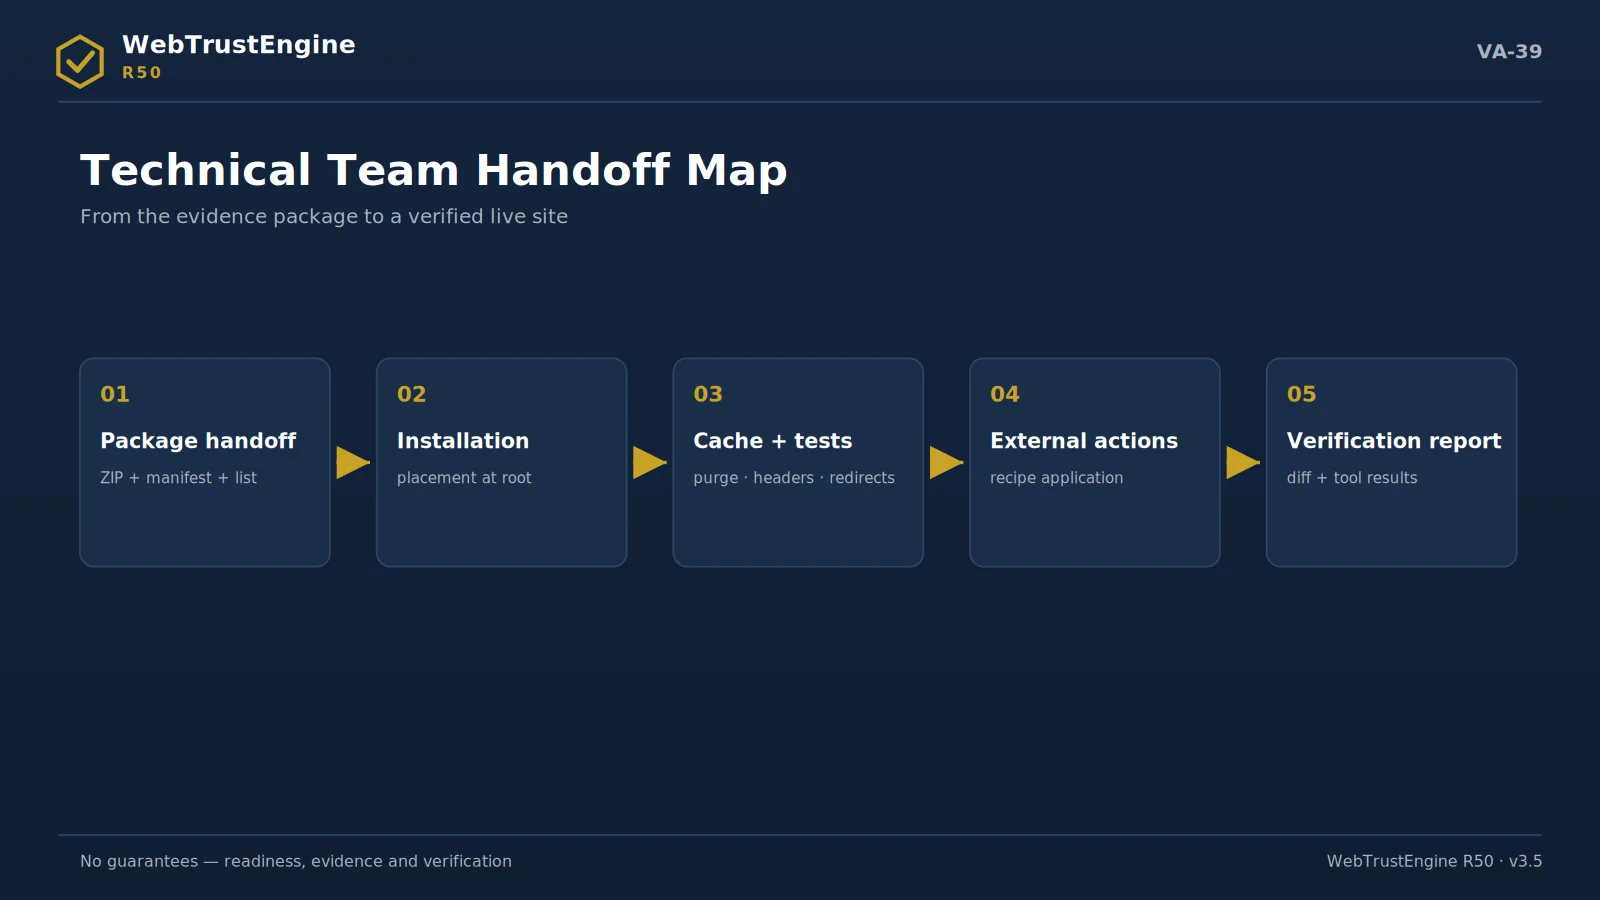
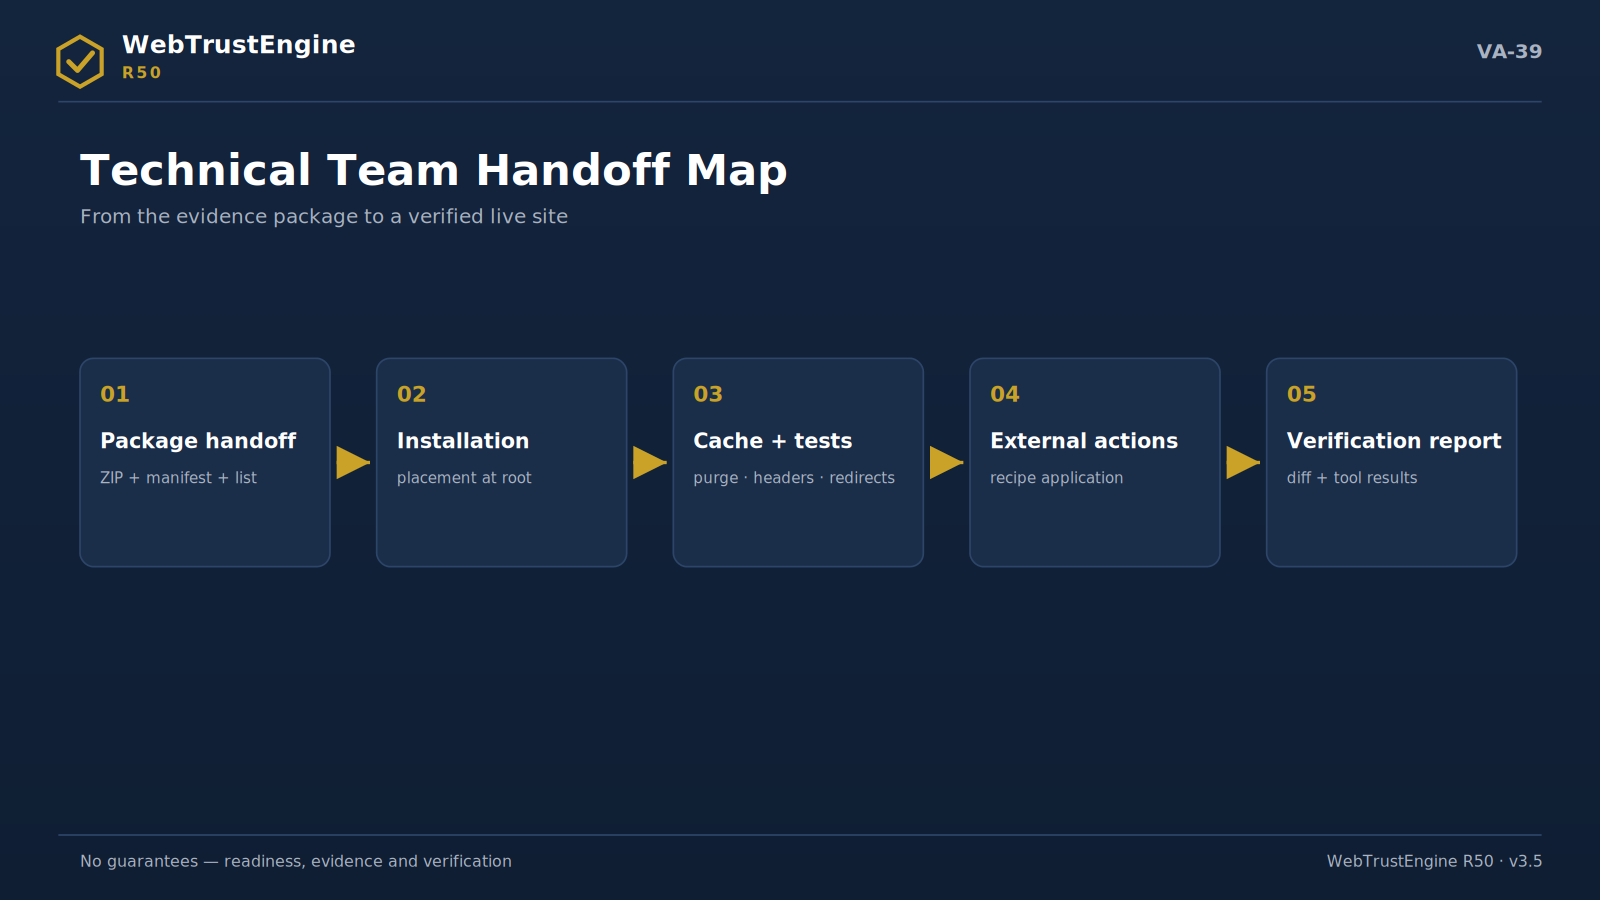
The handoff map: five steps from delivery to the verification report.
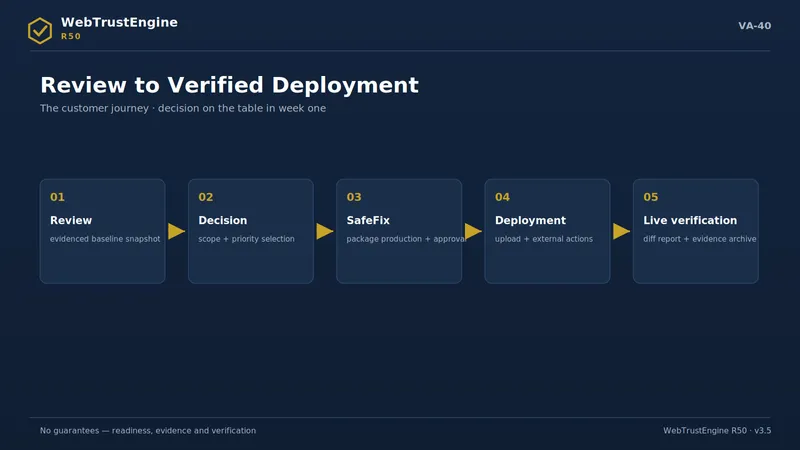
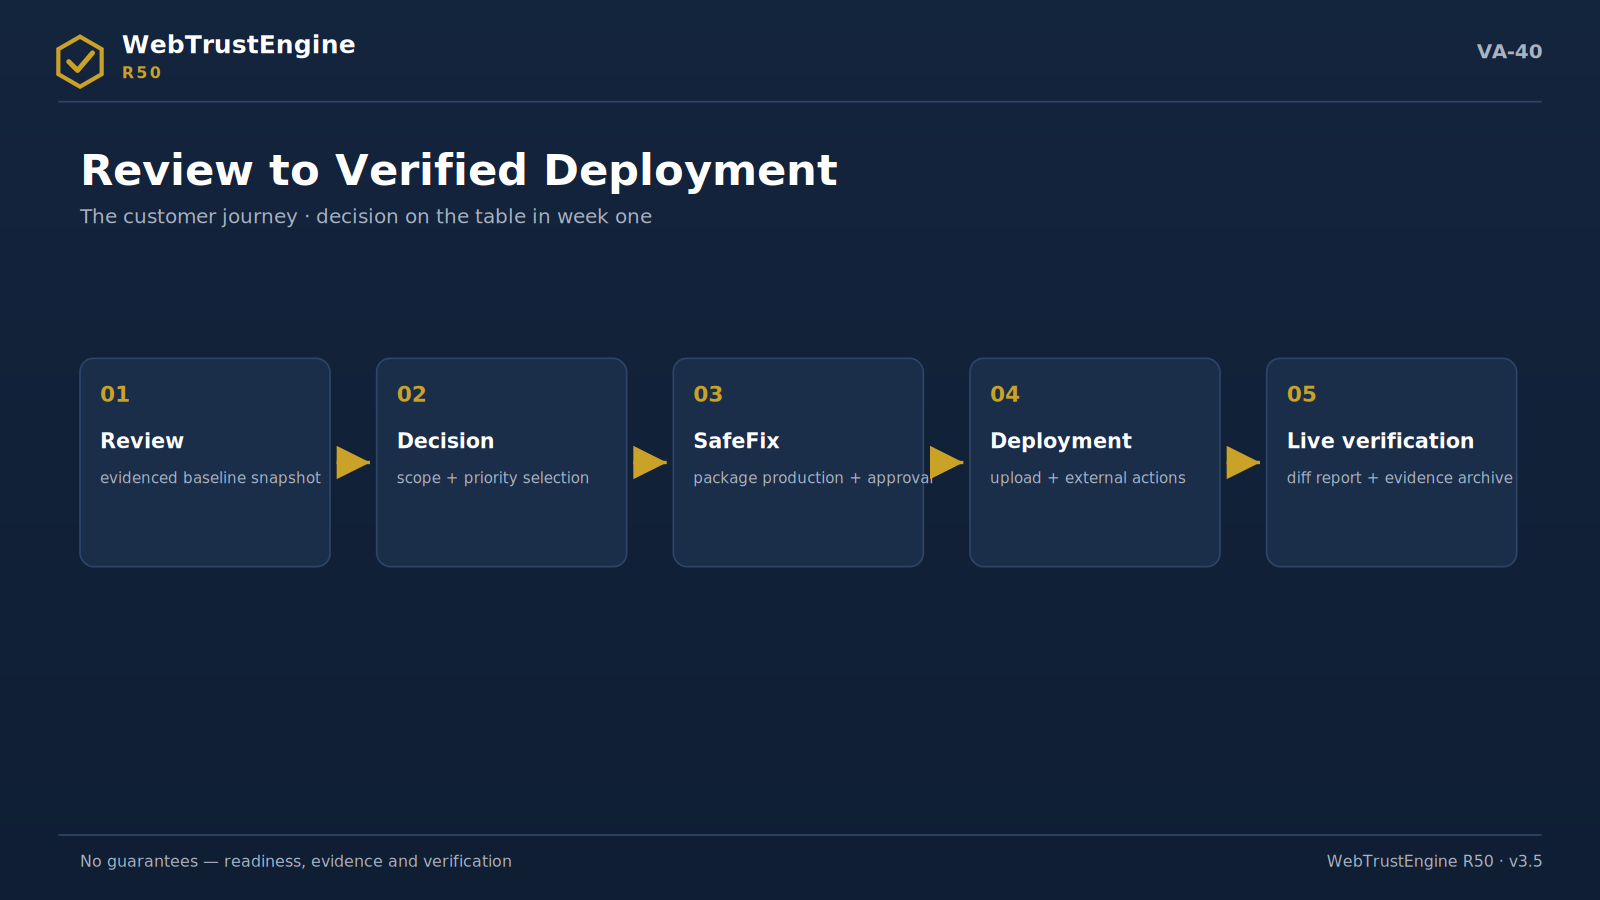
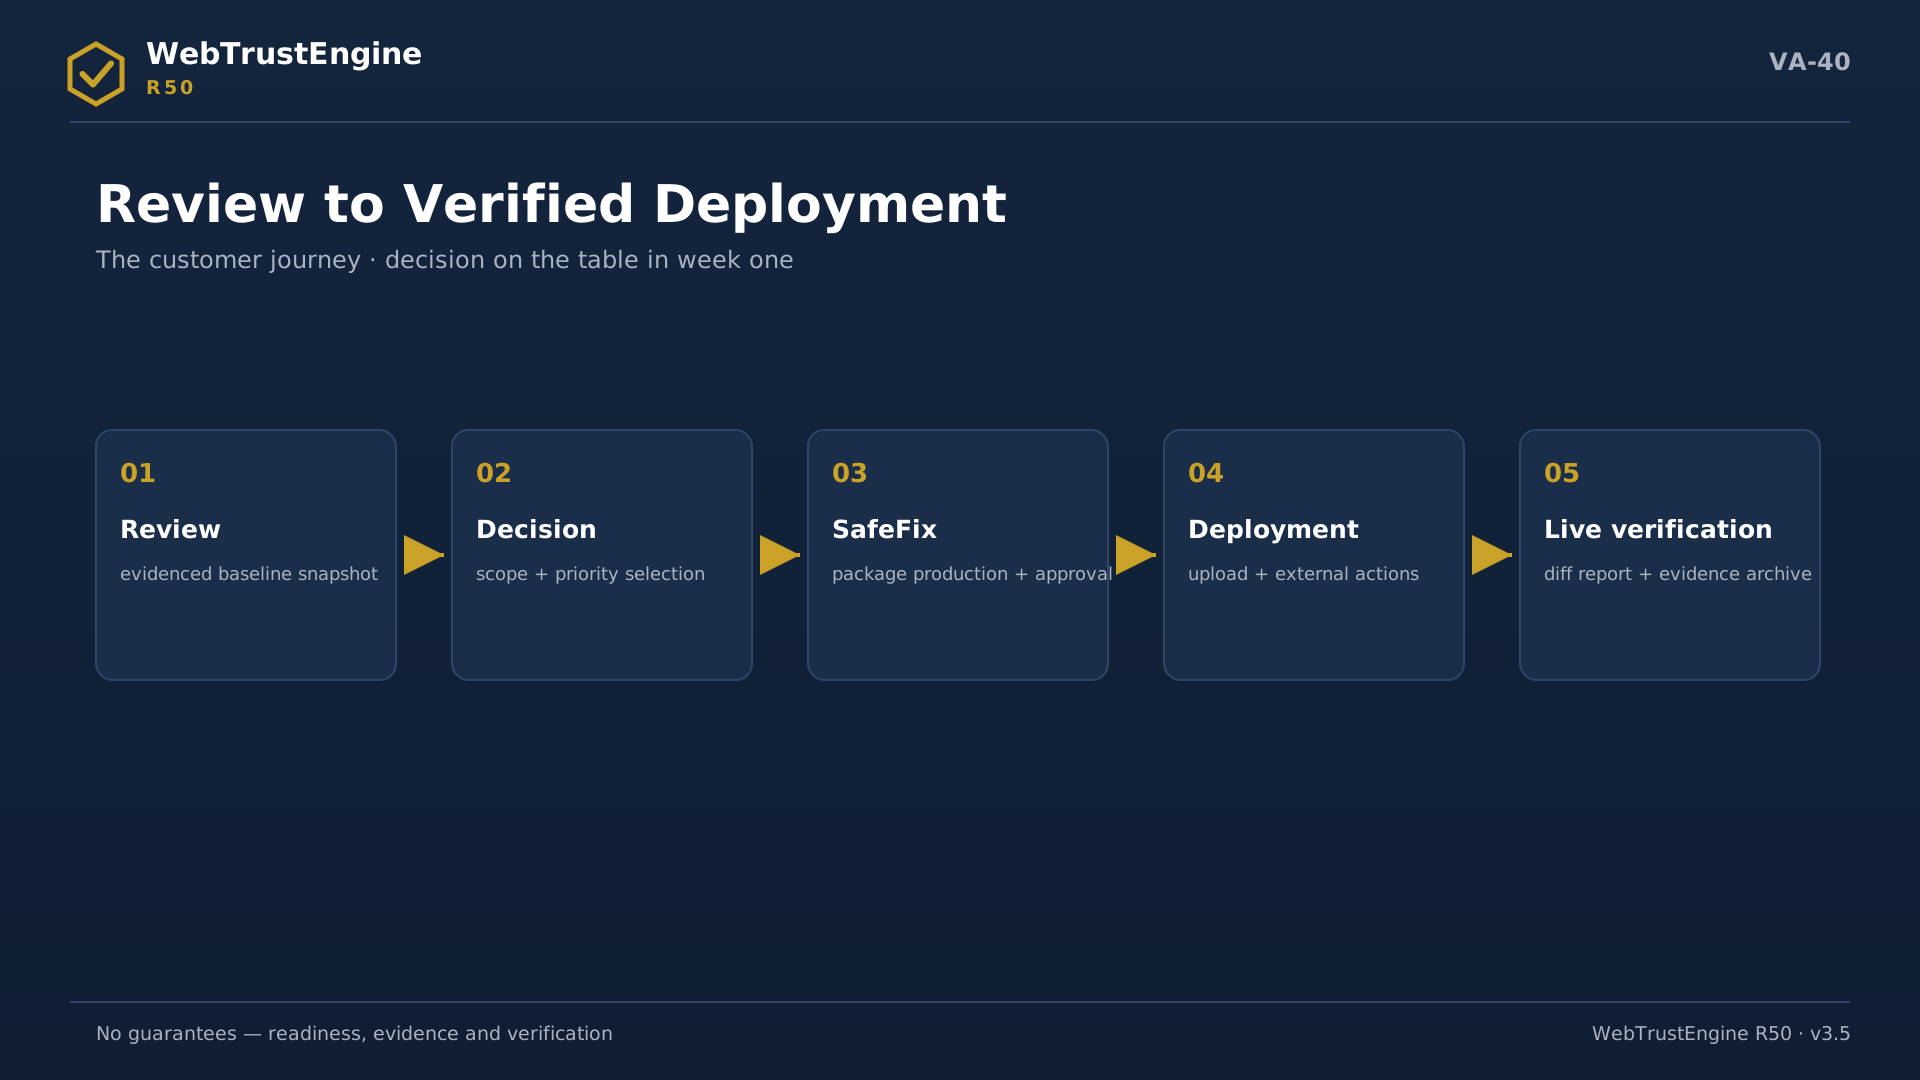
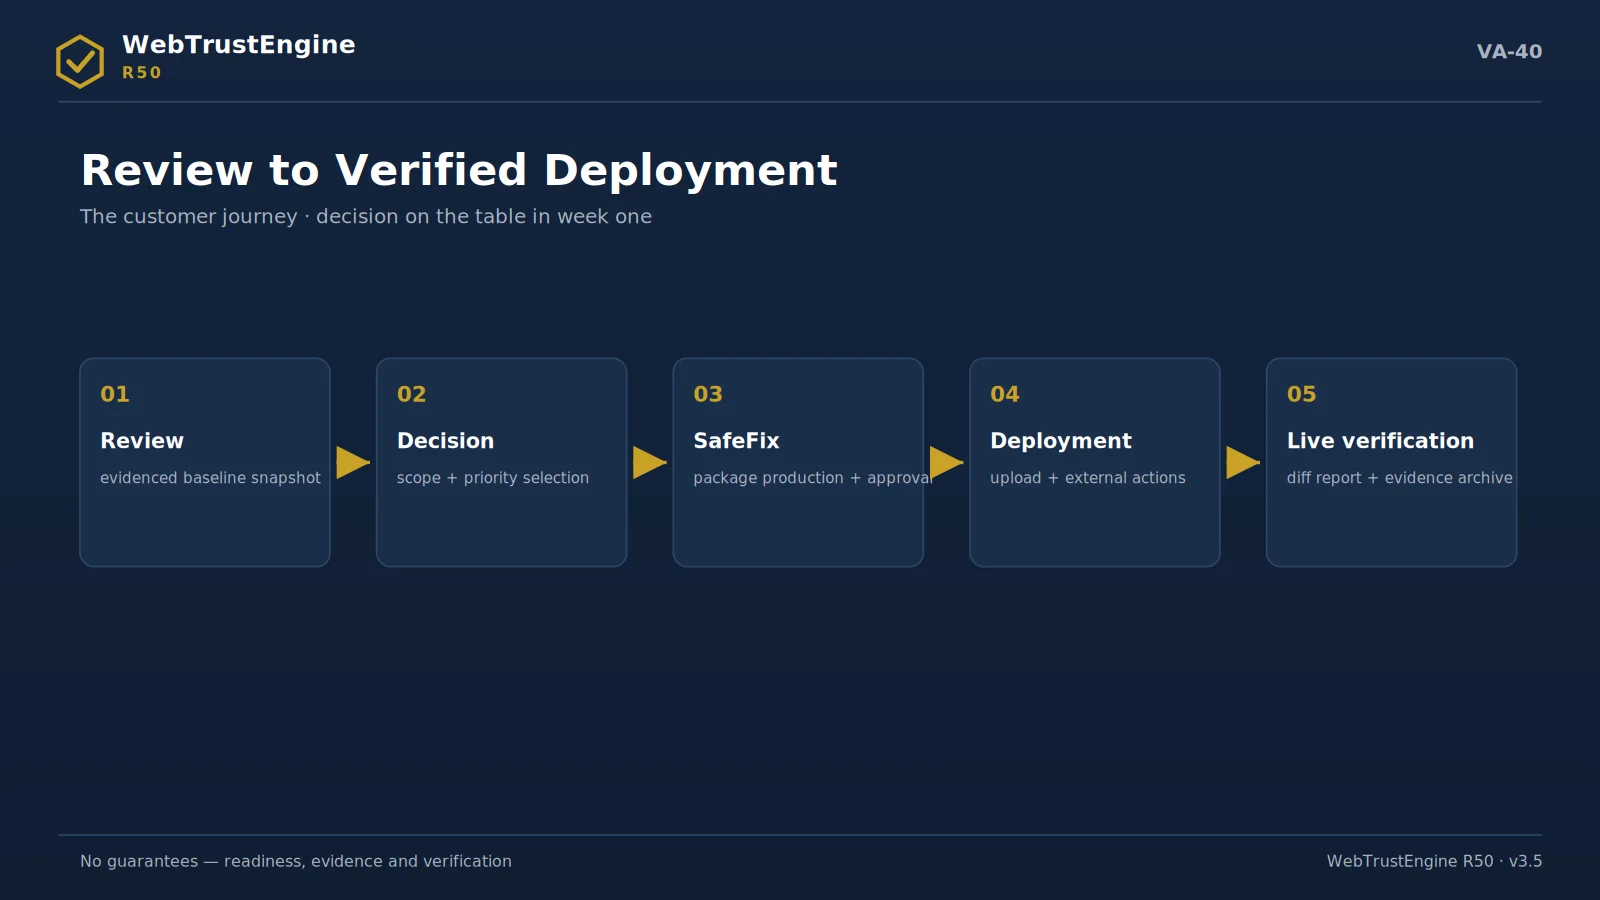
The customer journey: five stops from review to verified deployment.